


.jpg)


.jpg)


USA: Settore lattiero caseario
In questa pagina trovano spazio i dati relativi alle componenti fondamentali del settore lattiero caseario degli Stati Uniti, in una prospettiva temporale.
La finalità di questo prospetto è duplice:
- da un lato evidenzia la complessità del settore, che va preso in considerazione da più punti di vista: area della materia prima, varietà dei derivati, import, export, consumi interni;
- dall'altro, esemplifica il quadro di un mercato che alle grandi cifre della produzione fa corrispondere le grandi cifre dei consumi interni, sorrette dai volumi di importazione.
Ultimi rapporti meteo settimanali relativi all'andamento di precipitazioni e temperature.
Precipitazioni totali: quantitativo di pioggia;
Anomalie nelle temperature: variazioni rispetto allo storico delle temperature medie;
Temperatura Min: temperature minime;
Temperatura Max: temperature massime;
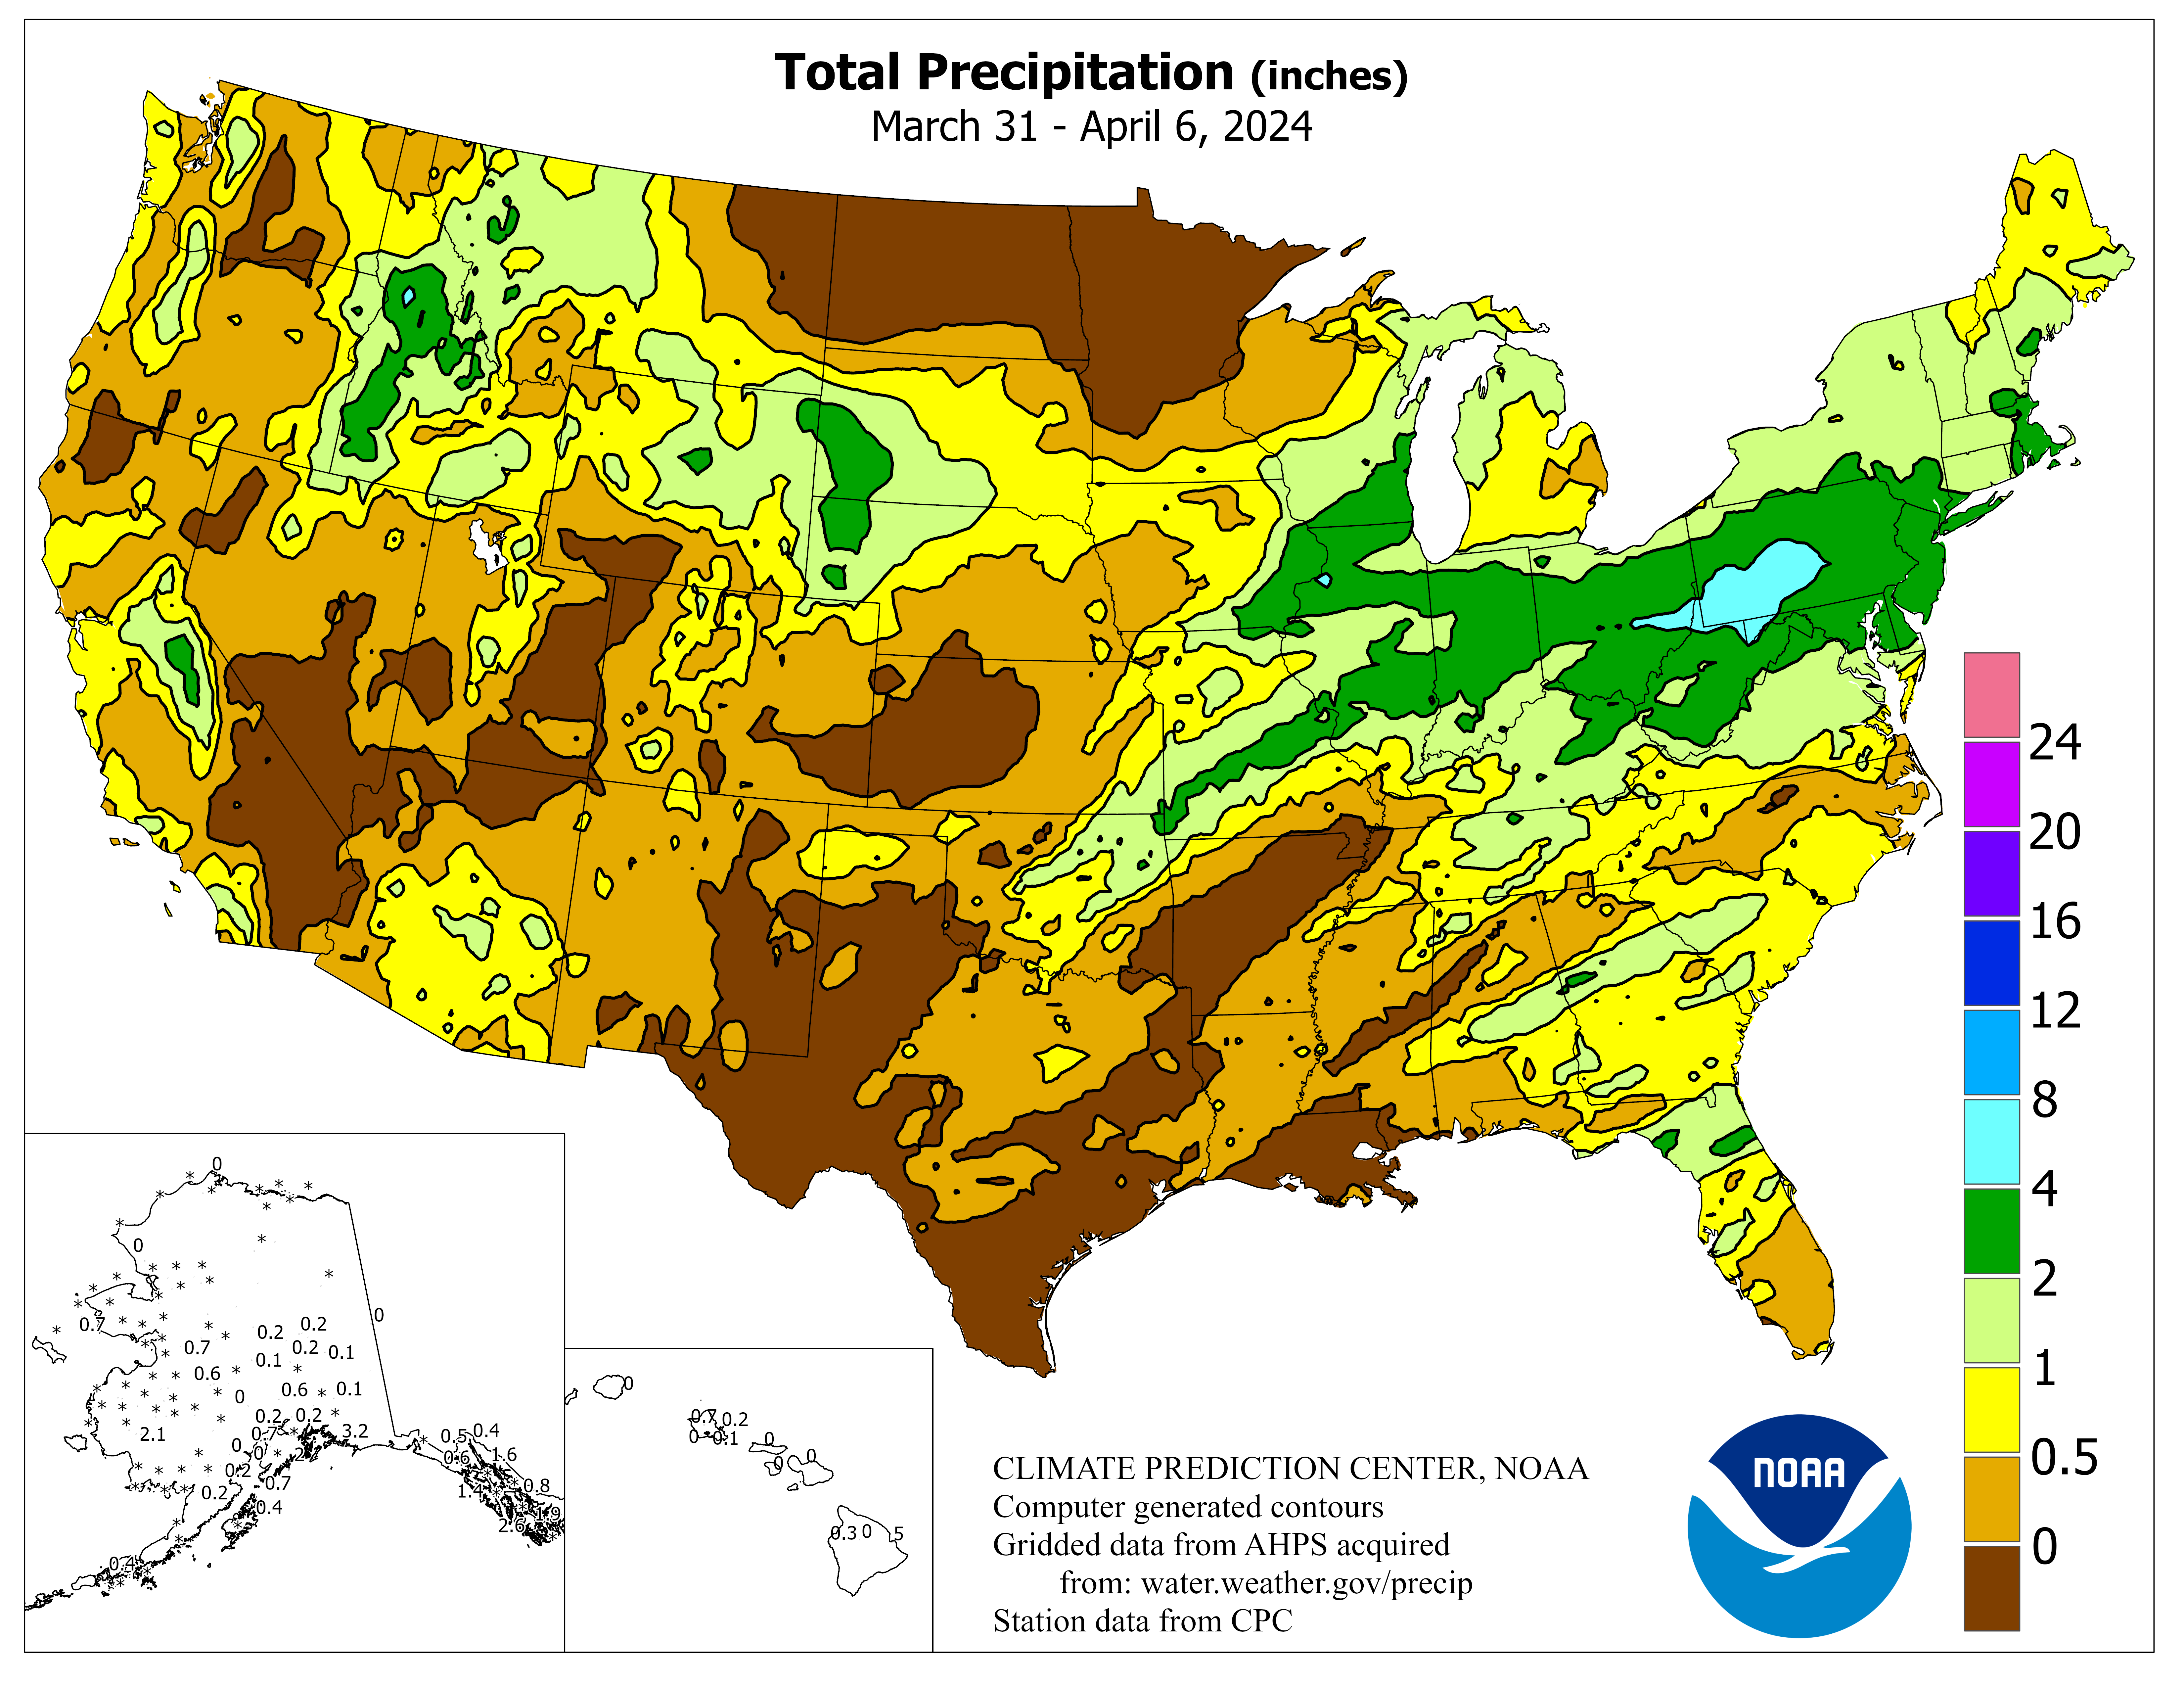
Precipitazioni totali
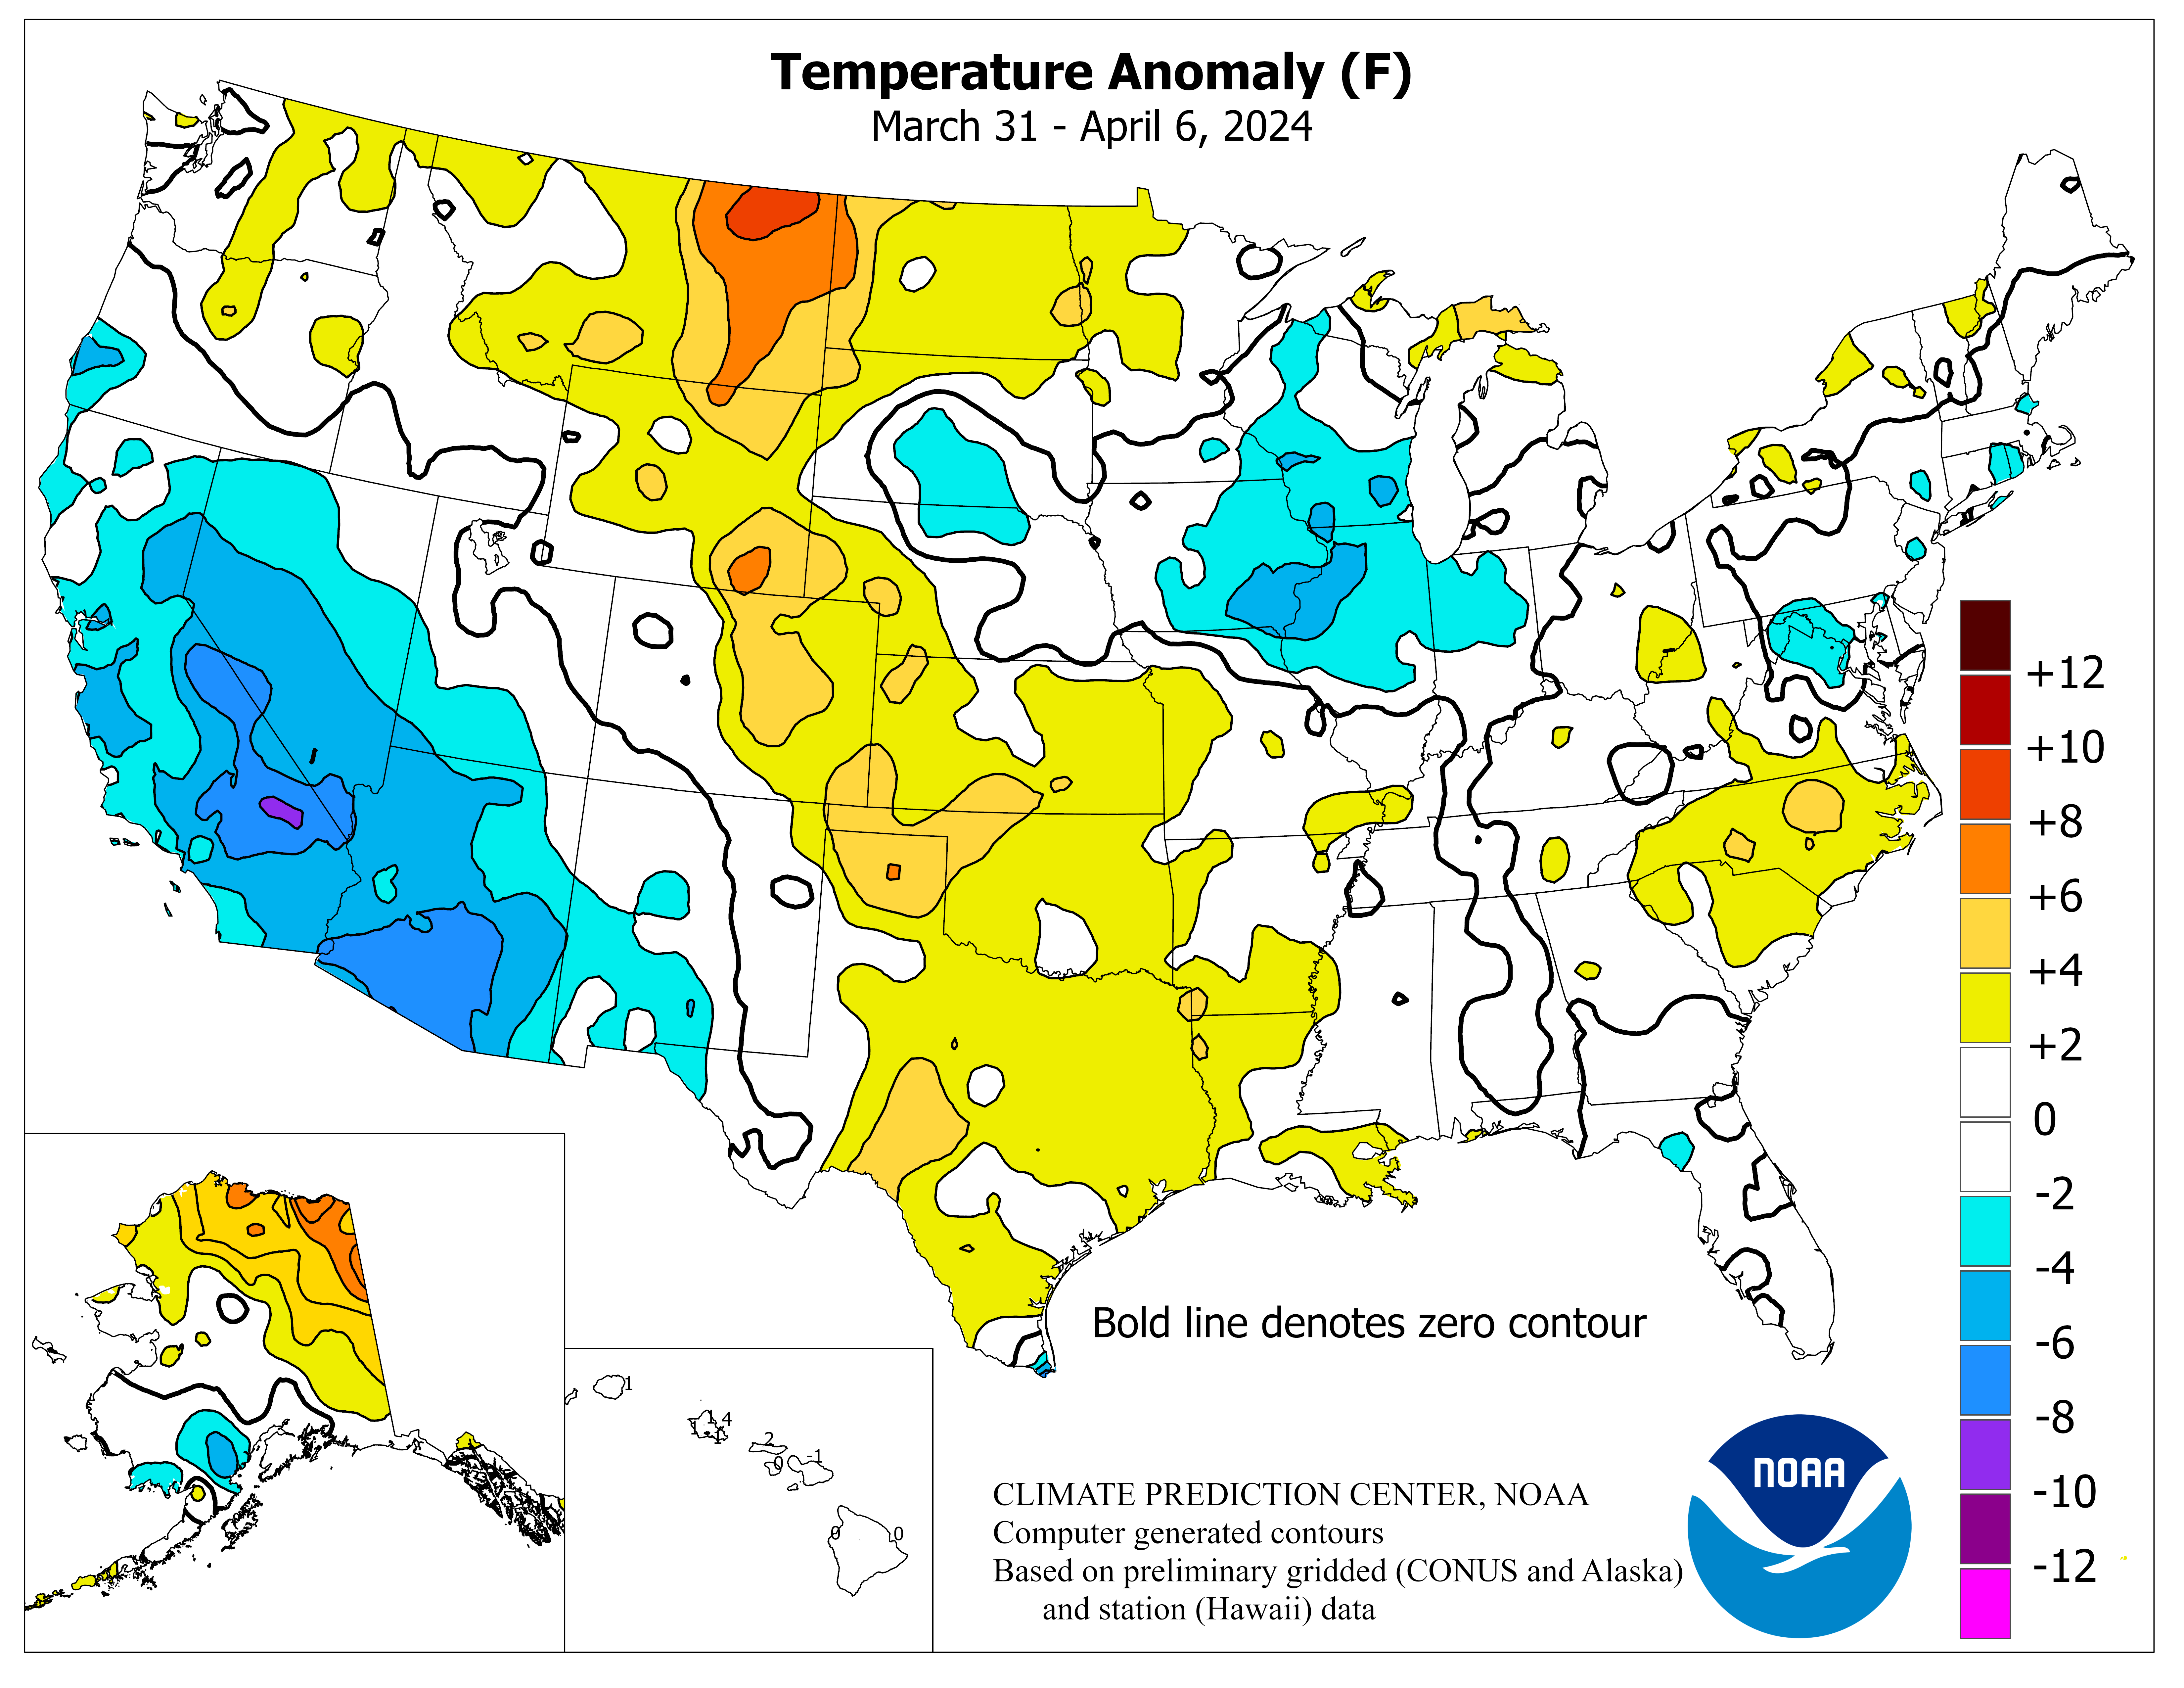
Anomalie nelle temperature
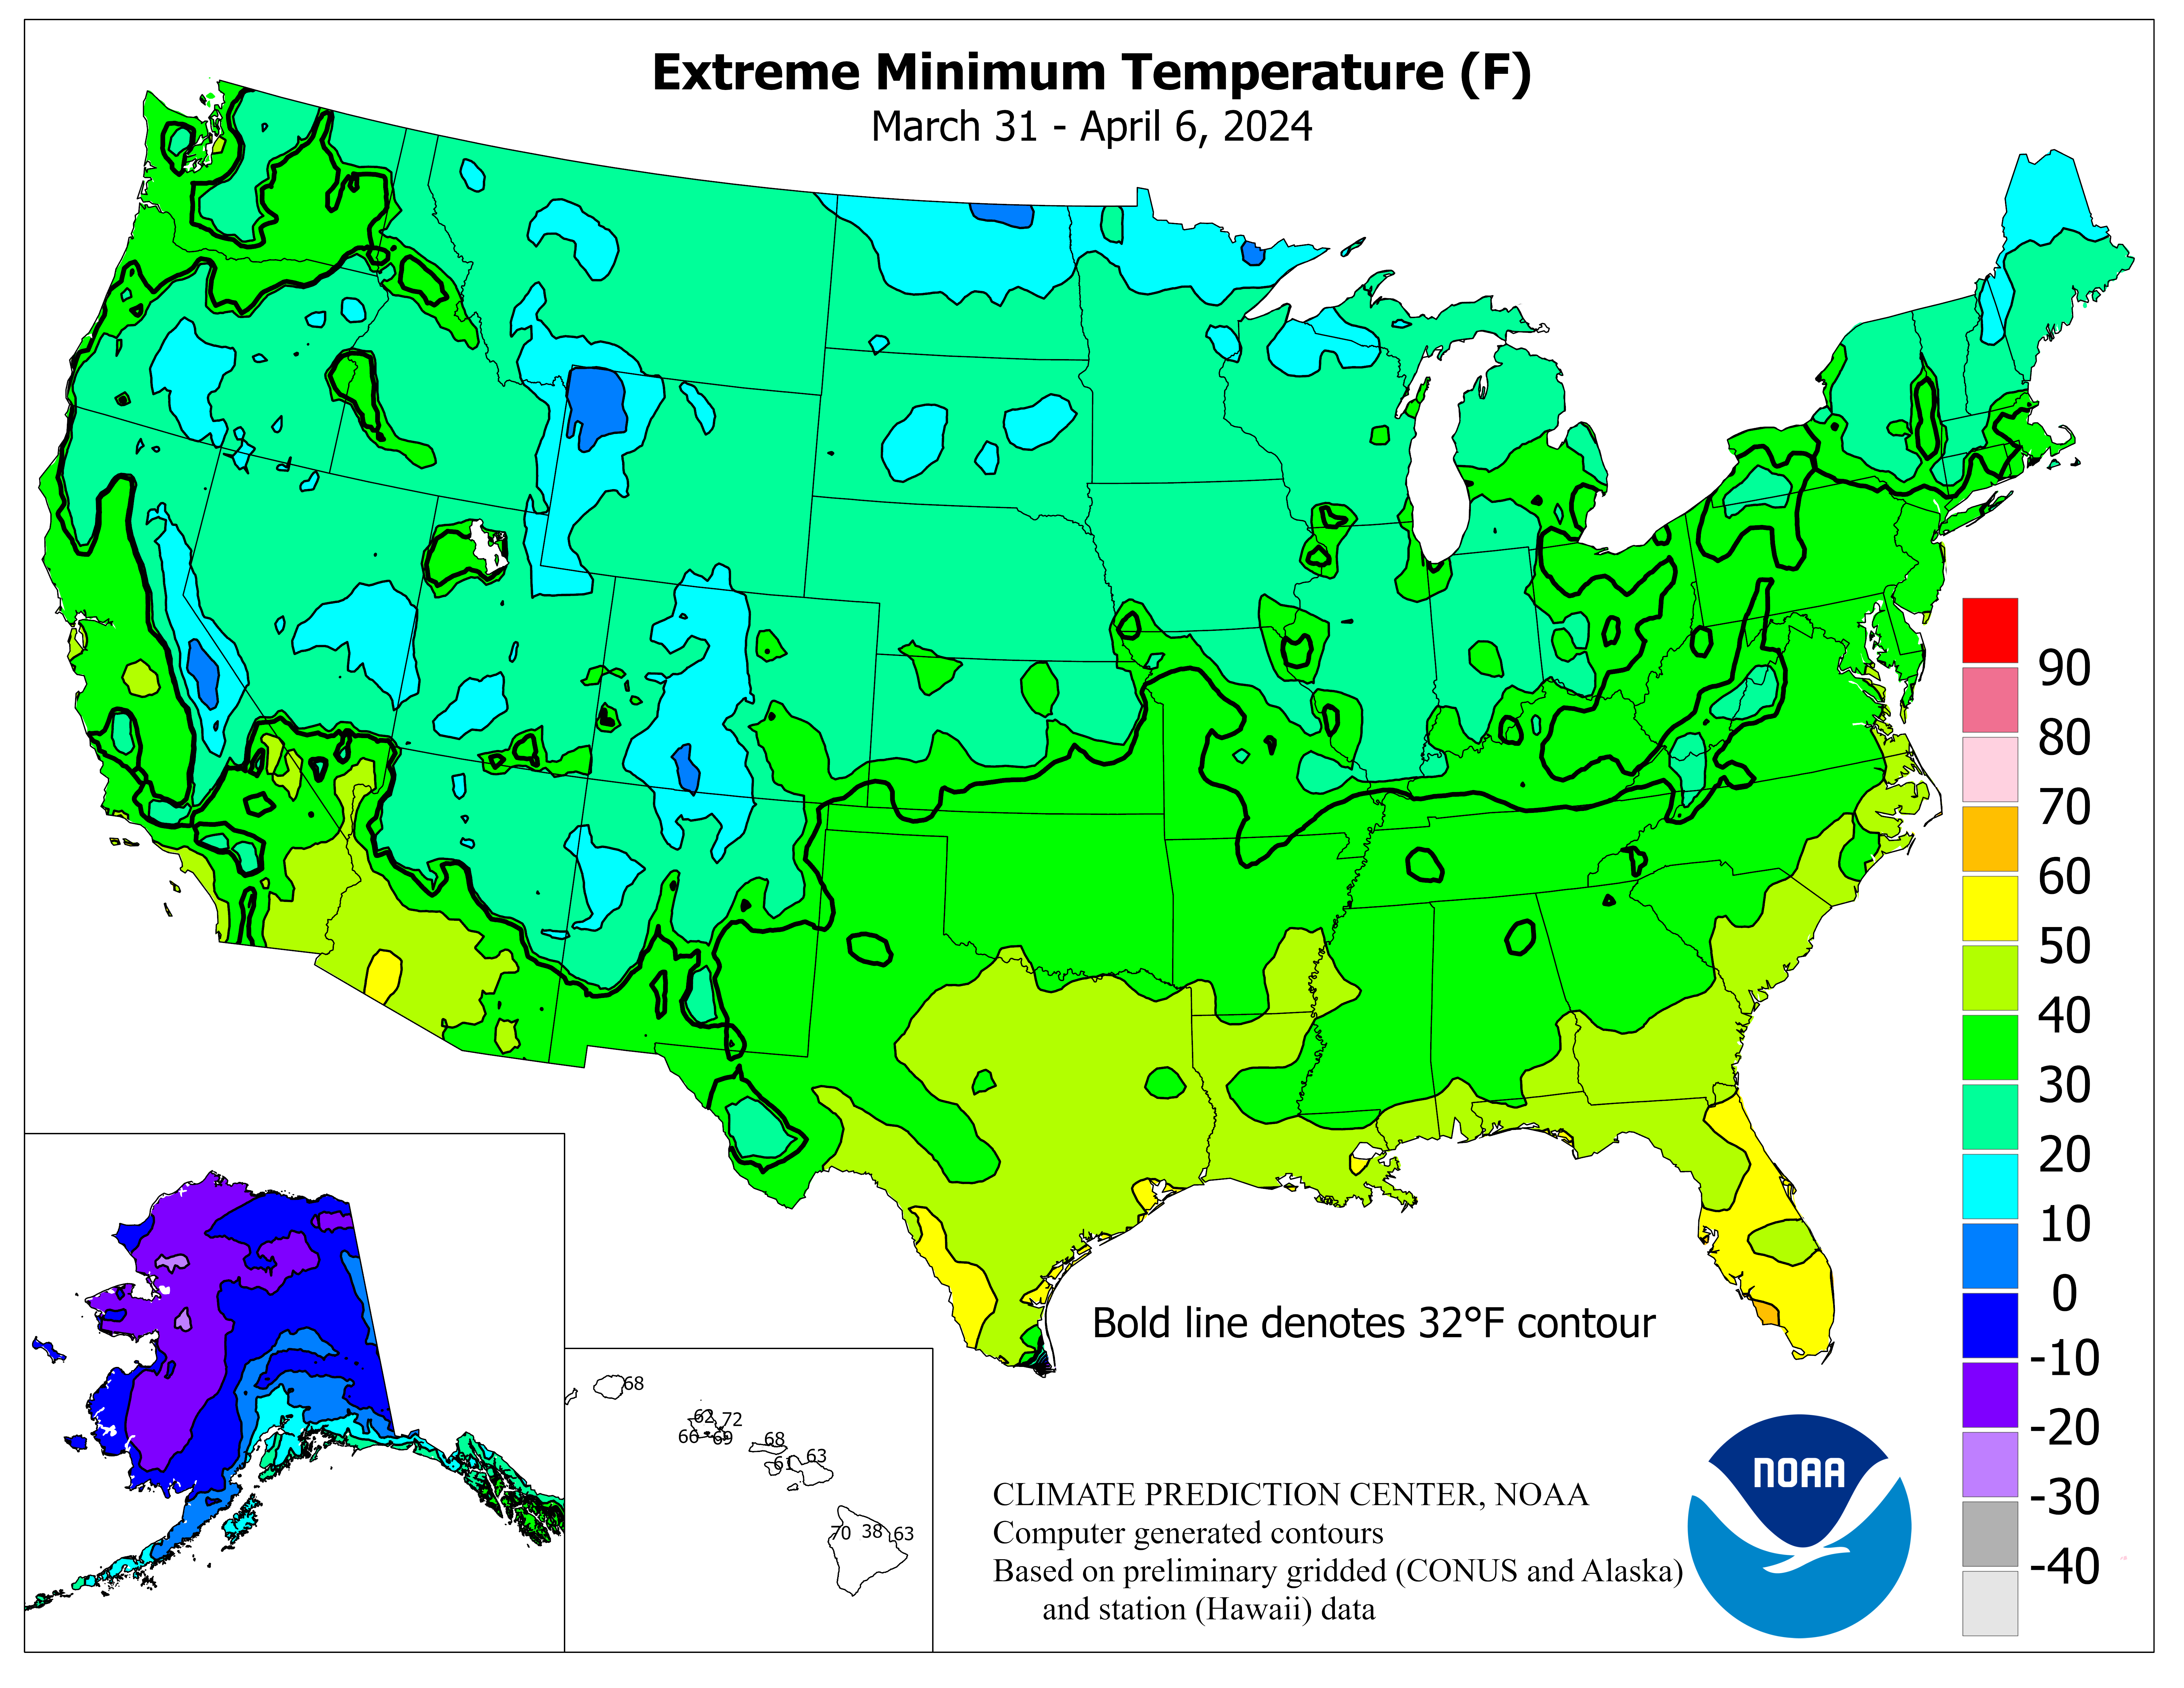
Temperatura Min
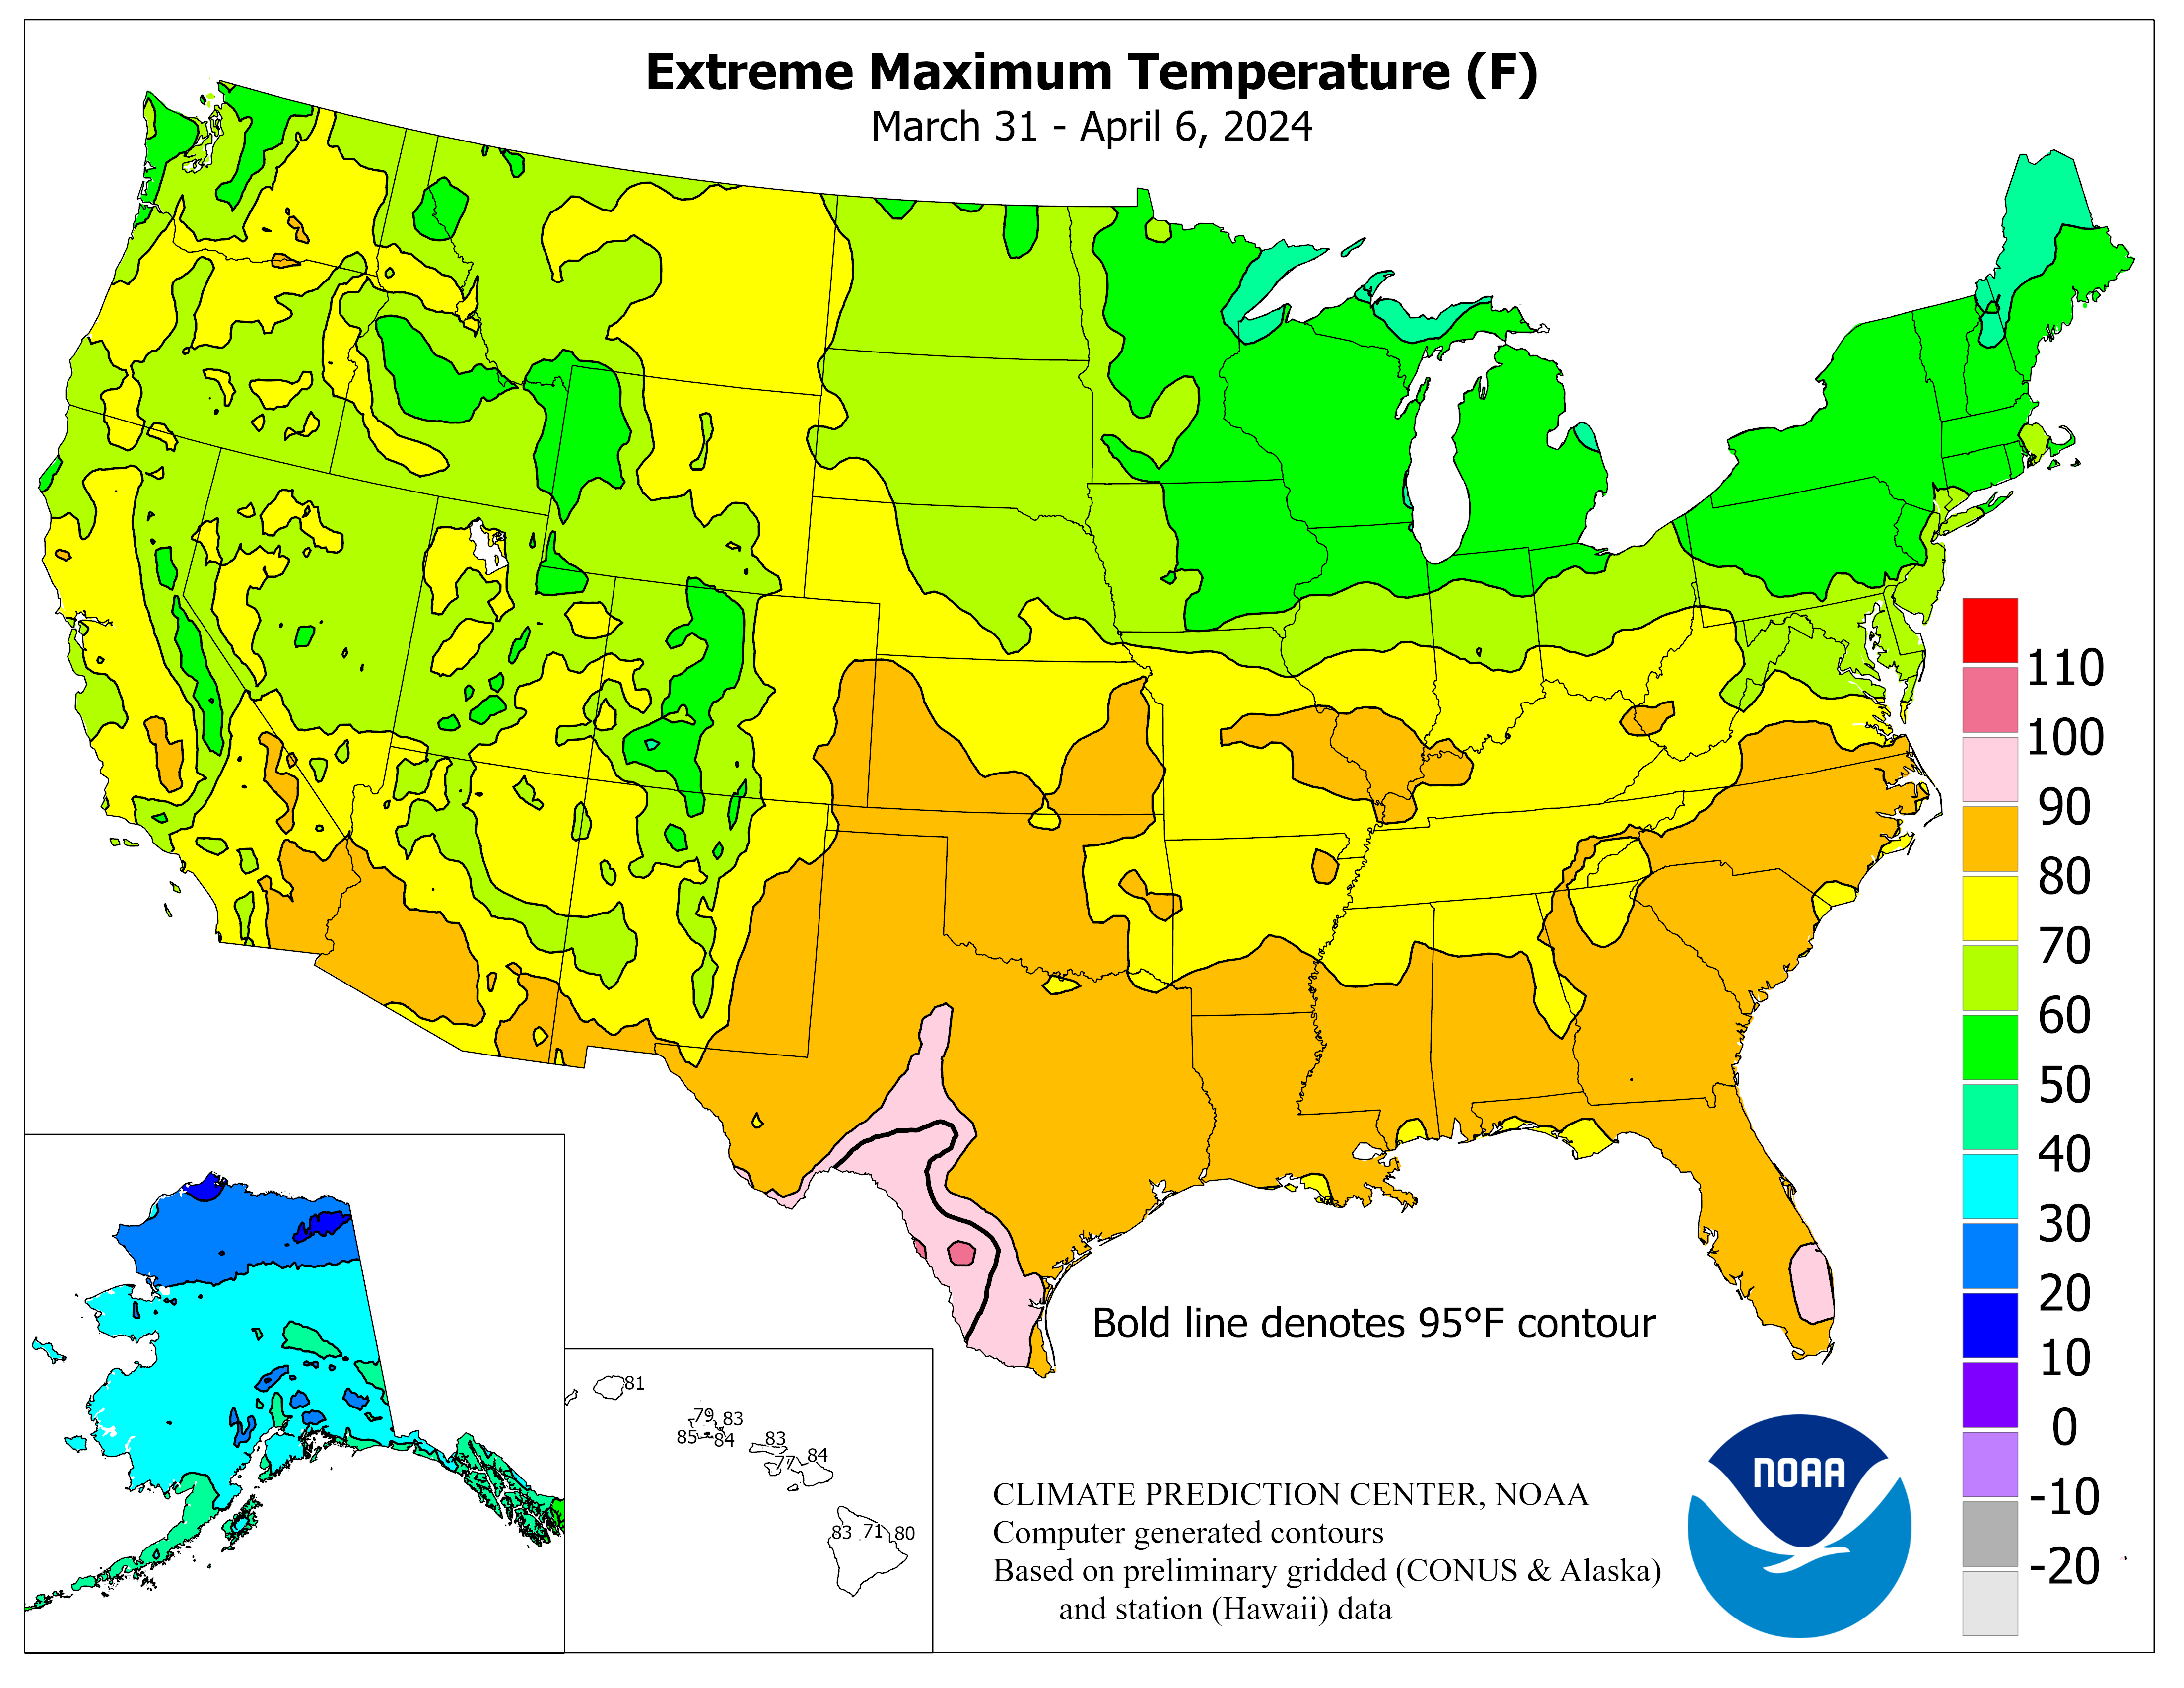
Temperatura Max
×
×
×
×
| USA: SETTORE LATTIERO CASEARIO | ||||||||||
| x 1.000 ton | ||||||||||
| AREA DELLA MATERIA PRIMA | 2020 | 2021 | 2022 | 2023 | 2023 | 2024 | % | Periodo | ||
| Aziende agricole ('000) | 1.993 | 1.960 | 1.901 | 1.897 | ||||||
| Vacche da latte ('000 head) | 9.442 | 9.386 | 9.405 | 9.349 | 9.418 | 9.333 | -0,9% | Gen-Mar 2024 | ||
| Produzioni di latte bovino | 101.292 | 102.646 | 102.702 | 102.678 | 25.781 | 25.803 | +0,1% | Gen-Mar 2024 | ||
| ± % sullo stesso periodo dell'anno precedente | +1,3% | +0,1% | 0,0% | |||||||
| Prezzo latte alla Stalla (€ per 100 Kg, IVA escl.)** | 35,00 | 34,59 | 53,13 | 41,76 | 45,87 | 41,35 | -9,8% | Gen-Feb 2024 | ||
| ± % sullo stesso periodo dell'anno precedente | -1,2% | +53,6% | -21,4% | |||||||
| Prezzo del Mais (North West Iowa, IA) (€\Ton) | 116,8 | 194,4 | 267,0 | 214,1 | 252,2 | 157,5 (p) | -37,5% | Gen-Apr 2024 | ||
| Prezzo dei Semi di Soia (Western Illinois, IL) (€\Ton) | 320,0 | 450,1 | 571,4 | 506,8 | 540,1 | 423,8 (p) | -21,5% | Gen-Apr 2024 | ||
| PRODUZIONE LATTIERO CASEARIE | 2020 | 2021 | 2022 | 2023 | 2023 | 2024 | % | Periodo | ||
| Latte ad uso alimentare | 21.031 | 20.190 | ||||||||
| Burro | 973 | 936 | 934 | 958 | 176 | 188 | +6,8% | Gen-Feb 2024 | ||
| Panna Acida | 663 | 677 | 678 | 684 | 109 | 113 | +4,0% | Gen-Feb 2024 | ||
| Formaggi | 6.005 | 6.242 | 6.379 | 6.393 | 1.046 | 1.059 | +1,2% | Gen-Feb 2024 | ||
| Italian Mozzarella | 2.016 | 2.040 | 2.099 | 2.098 | 342 | 350 | +2,3% | Gen-Feb 2024 | ||
| American Cheddar | 1.737 | 1.801 | 1.798 | 1.806 | 304 | 288 | -5,3% | Gen-Feb 2024 | ||
| Americal Colby & Jack & Monterey | 685 | 746 | 760 | 785 | 123 | 125 | +1,6% | Gen-Feb 2024 | ||
| Cream & Neufchatel | 459 | 465 | 513 | 510 | 86 | 90 | +5,4% | Gen-Feb 2024 | ||
| Italian Parmesan & Similari | 190 | 220 | 224 | 220 | 38 | 40 | +6,2% | Gen-Feb 2024 | ||
| Italian Provolone & Similari | 166 | 172 | 174 | 168 | 26 | 28 | +8,4% | Gen-Feb 2024 | ||
| Hispanic | 157 | 160 | 175 | 188 | 28 | 33 | +18,4% | Gen-Feb 2024 | ||
| Swiss | 147 | 150 | 159 | 152 | 25 | 25 | -0,8% | Gen-Feb 2024 | ||
| Italian Ricotta & Similari | 115 | 114 | 112 | 112 | 19 | 19 | -0,4% | Gen-Feb 2024 | ||
| Muenster | 85 | 87 | 87 | |||||||
| Feta | 62 | 77 | 64 | 67 | 9,1 | 11 | +18,6% | Gen-Feb 2024 | ||
| Blue e Gorgonzola | 33 | 40 | 42 | 38 | 6,0 | 6,0 | +0,0% | Gen-Feb 2024 | ||
| Italian Romano & Similari | 25 | 31 | 26 | 22 | 3,4 | 4,2 | +24,6% | Gen-Feb 2024 | ||
| Gouda | 20 | 26 | 28 | 28 | 4,6 | 5,0 | +8,7% | Gen-Feb 2024 | ||
| Brick | 0,7 | 0,9 | 0,7 | |||||||
| Altri formaggi | 107 | 114 | 117 | 110 | 17 | 18 | +4,0% | Gen- 2024 | ||
| Crema di Ricotta | 165 | 154 | 156 | 171 | 26 | 30 | +12,0% | Gen-Feb 2024 | ||
| Cagliata | 172 | 163 | 164 | 180 | 28 | 30 | +9,0% | Gen-Feb 2024 | ||
| Ricotta magra | 140 | 138 | 133 | 150 | 23 | 26 | +14,4% | Gen-Feb 2024 | ||
| WMP (polvere di latte intero) | 63 | 67 | 62 | 50 | 8,1 | 9,1 | +12,4% | Gen-Feb 2024 | ||
| NDM (polvere di latte scremato) | 885 | 929 | 893 | 853 | 162 | 130 | -20,1% | Gen-Feb 2024 | ||
| SMP (polvere di latte scremato) | 315 | 317 | 298 | 252 | 37 | 42 | +13,9% | Gen-Feb 2024 | ||
| Polvere di Siero | 435 | 405 | 415 | 421 | 65 | 68 | +4,4% | Gen-Feb 2024 | ||
| Latte Condensato (Latte intero e scremato) | 262 | 249 | 253 | |||||||
| Lattosio | 508 | 509 | 504 | 499 | 78 | 80 | +3,1% | Gen-Feb 2024 | ||
| WPC (Sieroproteine Concentrate in Polvere) | 217 | 210 | 205 | 224 | 36 | 37 | +3,5% | Gen-Feb 2024 | ||
| WPI 90 (Whey Protein Isolated) | 51 | 59 | 59 | 54 | 7,9 | 13 | +66,2% | Gen-Feb 2024 | ||
| Yogurt | 2.046 | 2.152 | 2.097 | 2.154 | 359 | 361 | +0,6% | Gen-Feb 2024 | ||
| Yogurt Gelato (Mio Litri) | 133 | 153 | 173 | 173 | 30 | 28 | -5,1% | Gen-Feb 2024 | ||
| Gelato, regular, hard (Mio Litri) | 2.903 | 2.726 | 2.751 | 2.706 | 421 | 391 | -7,3% | Gen-Feb 2024 | ||
| Gelato lowfat, totale (Mio Litri) | 1.752 | 1.808 | 1.690 | 1.591 | 231 | 214 | -7,0% | Gen-Feb 2024 | ||
| Gelato, lowfat, hard (Mio Litri) | 949 | 865 | 828 | 841 | 123 | 108 | -12,3% | Gen-Feb 2024 | ||
| Gelato, lowfat, soft (Mio Litri) | 803 | 943 | 861 | 750 | 108 | 107 | -0,9% | Gen-Feb 2024 | ||
| Gelato, nonfat, hard (Mio Litri) | 21 | 25 | 28 | 31 | 4,0 | 3,8 | -6,8% | Gen-Feb 2024 | ||
| EXPORT | 2020 | 2021 | 2022 | 2023 | 2023 | 2024 | % | Periodo | ||
| Latte Sfuso e Confez. (HS 040110+040120) |
|
106 | 120 | 120 | 102 | 17 | 16 | -5,8% | Gen-Feb 2024 | |
| Crema di latte (HS 040130+040140+040150) |
|
24 | 26 | 28 | 37 | 4,5 | 5,4 | +18,4% | Gen-Feb 2024 | |
| Yogurt e latticello (HS 0403) |
|
37 | 41 | 41 | 48 | 6,9 | 8,7 | +26,4% | Gen-Feb 2024 | |
| Latte Condensato (HS 040291+040299) |
|
11 | 16 | 20 | 22 | 2,9 | 2,9 | -1,2% | Gen-Feb 2024 | |
| Burro (HS 0405) |
|
27 | 57 | 82 | 37 | 8,1 | 5,7 | -29,9% | Gen-Feb 2024 | |
| di cui: | ||||||||||
| Burro anidro (HS 040590) |
|
5,1 | 13 | 16 | 6,1 | 1,2 | 1,0 | -17,1% | Gen-Feb 2024 | |
| Formaggi (HS 0406) |
|
358 | 404 | 454 | 438 | 67 | 82 | +22,2% | Gen-Feb 2024 | |
| SMP (polvere di latte magro - HS 040210) |
|
816 | 880 | 837 | 810 | 131 | 126 | -3,9% | Gen-Feb 2024 | |
| WMP (polvere di latte intero - HS 040221+040229) |
|
39 | 39 | 39 | 26 | 3,1 | 3,5 | +15,7% | Gen-Feb 2024 | |
| Polvere di siero (HS 0404) |
|
546 | 592 | 663 | 534 | 87 | 89 | +2,5% | Gen-Feb 2024 | |
| di cui: | ||||||||||
| Sweet dairy Whey (12% protein) e WPC (HS 040410) |
|
504 | 551 | 615 | 490 | 80 | 82 | +2,7% | Gen-Feb 2024 | |
| Caseine (HS 350110) |
|
1,9 | 1,8 | 2,1 | 1,1 | 0,2 | 0,5 | +180,6% | Gen-Feb 2024 | |
| Caseinati (HS 350190) |
|
1,6 | 2,1 | 2,5 | 2,6 | 0,4 | 0,5 | +48,3% | Gen-Feb 2024 | |
| Lattosio uso farmaceutico (HS 170211) |
|
304 | 322 | 413 | 436 | 71 | 69 | -1,9% | Gen-Feb 2024 | |
| Lattosio uso alimentare (HS 170219) |
|
75 | 69 | 40 | 37 | 5,8 | 3,4 | -41,1% | Gen-Feb 2024 | |
| Latte per l'infanzia (HS 190110) |
|
32 | 28 | 29 | 28 | 3,5 | 4,3 | +21,2% | Gen-Feb 2024 | |
| Fat-Filled Milk Powder (FFMP) (HS 190190) |
|
173 | 162 | 176 | 178 | 32 | 26 | -19,8% | Gen-Feb 2024 | |
| Whey Protein Isolate (WPI) (HS 350220) |
|
59 | 65 | 65 | 76 | 10 | 12 | +18,5% | Gen-Feb 2024 | |
|
Bevande vegetali non alcoliche a base di latte, esclusa cioccolata |
|
43 | 57 | 52 | 43 | 8,2 | 5,4 | -33,8% | Gen-Feb 2024 | |
|
Bevande vegetali non alcoliche, esclusa frutta, vegetali, cioccolata, latte e birra |
|
347 | 357 | 301 | 309 | 51 | 44 | -13,7% | Gen-Feb 2024 | |
| IMPORT | 2020 | 2021 | 2022 | 2023 | 2023 | 2024 | % | Periodo | ||
| Latte Sfuso e Confez. (HS 040110+040120) |
|
33 | 35 | 26 | 24 | 4,2 | 4,0 | -5,0% | Gen-Feb 2024 | |
| Crema di latte (HS 040130+040140+040150) |
|
25 | 19 | 32 | 58 | 5,7 | 8,2 | +42,6% | Gen-Feb 2024 | |
| Yogurt e latticello (HS 0403) |
|
25 | 27 | 35 | 41 | 6,5 | 7,8 | +20,4% | Gen-Feb 2024 | |
| Latte Condensato (HS 040291+040299) |
|
26 | 23 | 37 | 37 | 5,5 | 8,7 | +59,4% | Gen-Feb 2024 | |
| Burro (HS 0405) |
|
69 | 63 | 73 | 81 | 13 | 16 | +20,0% | Gen-Feb 2024 | |
| di cui: | ||||||||||
| Burro anidro (HS 040590) |
|
27 | 14 | 21 | 19 | 4,1 | 3,7 | -8,1% | Gen-Feb 2024 | |
| Formaggi (HS 0406) |
|
165 | 188 | 189 | 194 | 27 | 31 | +15,2% | Gen-Feb 2024 | |
| SMP (polvere di latte magro - HS 040210) |
|
0,7 | 0,4 | 0,6 | 0,8 | 0,0 | 0,0 | +40,4% | Gen-Feb 2024 | |
| WMP (polvere di latte intero - HS 040221+040229) |
|
23 | 12 | 16 | 14 | 2,5 | 2,5 | -2,5% | Gen-Feb 2024 | |
| Polvere di siero (HS 0404) |
|
84 | 84 | 79 | 81 | 16 | 12 | -25,0% | Gen-Feb 2024 | |
| di cui: | ||||||||||
| Sweet dairy Whey (12% protein) e WPC (HS 040410) |
|
41 | 44 | 44 | 44 | 8,3 | 7,3 | -11,6% | Gen-Feb 2024 | |
| Caseine (HS 350110) |
|
46 | 53 | 81 | 51 | 16 | 8,7 | -45,6% | Gen-Feb 2024 | |
| Caseinati (HS 350190) |
|
21 | 22 | 24 | 31 | 6,3 | 3,3 | -48,3% | Gen-Feb 2024 | |
| Lattosio uso farmaceutico (HS 170211) |
|
2,7 | 2,9 | 3,2 | 3,3 | 0,5 | 0,4 | -28,7% | Gen-Feb 2024 | |
| Lattosio uso alimentare (HS 170219) |
|
0,5 | 0,4 | 0,5 | 0,8 | 0,1 | 0,1 | -35,9% | Gen-Feb 2024 | |
| Latte per l'infanzia (HS 190110) |
|
9,3 | 17 | 42 | 40 | 5,6 | 13 | +138,5% | Gen-Feb 2024 | |
| Fat-Filled Milk Powder (FFMP) (HS 190190) |
|
195 | 230 | 255 | 252 | 41 | 41 | +0,2% | Gen-Feb 2024 | |
| Whey Protein Isolate (WPI) (HS 350220) |
|
8,5 | 14 | 11 | 9,9 | 1,4 | 3,3 | +146,2% | Gen-Feb 2024 | |
|
Bevande vegetali non alcoliche a base di latte, esclusa cioccolata |
|
4,7 | 6,6 | 7,3 | 11 | 0,8 | 3,4 | +319,4% | Gen-Feb 2024 | |
|
Bevande vegetali non alcoliche, esclusa frutta, vegetali, cioccolata, latte e birra |
|
792 | 959 | 582 | 103 | 14 | 17 | +20,3% | Gen-Feb 2024 | |
| STOCK (al 31 Dicembre) | 2020 | 2021 | 2022 | 2023 | 2023 | 2024 | % | Periodo | ||
| Burro | 124 | 90 | 98 | 91 | 140 | 144 | +2,3% | Mar 2024 | ||
| Formaggi (senza formaggi freschi) | 633 | 654 | 656 | 654 | 662 | 662 | -0,1% | Mar 2024 | ||
| SMP ad uso alimentare | 131 | 115 | 116 | 92 | 143 | 95 | -33,6% | Feb 2024 | ||
| SMP ad uso zootecnico | 3,9 | 2,7 | 3,7 | 2,9 | 4,6 | 3,6 | -21,5% | Feb 2024 | ||
| WMP (Polvere di latte intero) | 7,7 | 11 | 6,9 | 5,9 | 7,6 | 5,5 | -27,4% | Feb 2024 | ||
| Latte Condensato (Latte intero e scremato) | 16 | 21 | 18 | 18 | ||||||
| Polvere di siero ad uso alimentare | 29 | 25 | 31 | 30 | 30 | 30 | +2,2% | Feb 2024 | ||
| Polvere di siero ad uso zootecnico | 0,3 | 0,3 | 0,6 | 1,8 | 1,6 | 2,7 | +71,0% | Feb 2024 | ||
| WPC | 29 | 31 | 37 | 28 | 39 | 26 | -33,2% | Feb 2024 | ||
| I° Classificazione | ||||||||||
| - WPC ad uso alimentare | 28 | 30 | 37 | 27 | 39 | 26 | -34,1% | Feb 2024 | ||
| - WPC ad uso zootecnico | 0,4 | 0,7 | 0,4 | 0,8 | 0,4 | 0,6 | +50,5% | Feb 2024 | ||
| 2° Classificazione | ||||||||||
| - WPC 25-49.9% s.s. | 12 | 11 | 13 | 11 | 14 | 10 | -29,6% | Feb 2024 | ||
| - WPC 50-89.9% s.s. | 16 | 21 | 24 | 16 | 25 | 16 | -35,2% | Feb 2024 | ||
| Lattosio | 56 | 76 | 78 | 48 | 75 | 49 | -35,1% | Feb 2024 | ||
| CONSUMI INTERNI (Fonte: FAS-USDA) | 2020 | 2021 | 2022 | 2023 | 2023 | 2024(f) | % | Periodo | ||
| Formaggio | 5.745 | 5.964 | 6.055 | 6.106 | 6.106 | 6.231 | +2,0% | Gen-Dic 2024 | Burro | 978 | 981 | 924 | 1.004 | 1.004 | 1.009 | +0,5% | Gen-Dic 2024 | SMP | 384 | 374 | 366 | 324 | 324 | 391 | +20,7% | Gen-Dic 2024 | WMP | 34 | 33 | 40 | 33 | 33 | 25 | -24,2% | Gen-Dic 2024 |
| CONSUMI PRO-CAPITE (kg) | 2020 | 2021 | 2022 | 2023 | 2023 | 2024(f) | % | Periodo | ||
| Formaggi | 17,10 | 17,70 | 17,90 | 17,96 | ||||||
| Burro | 2,91 | 2,91 | 2,73 | 2,95 | ||||||
| SMP | 1,14 | 1,11 | 1,08 | 0,95 | ||||||
| WMP | 0,10 | 0,10 | 0,12 | 0,10 | ||||||
| % Tasso di autoapprovvigionamento | 111,6% | 112,7% | 112,6% | 111,9% | ||||||
| INDICATORI SOCIO-ECONOMICI | 2020 | 2021 | 2022 | 2023 | 2023 | 2024(f) | % | Periodo | ||
| PIL (prodotto interno lordo) | -2,21% | 5,80% | 1,94% | 2,53% | 2,53% | 2,30% | Gen-Dic 2024 | |||
| CPI (indice dei prezzi al consumo) | 1,23% | 4,70% | 8,00% | 4,12% | 4,12% | 2,70% | Gen-Dic 2024 | |||
| Popolazione (in migliaia) | 335.942 | 336.998 | 338.290 | 339.997 | ||||||
| Reddito pro-capite (U.S. dollars) | 63.577 | 70.160 | 76.343 (e) | 80.412 (e) | ||||||
| Reddito pro-capite (€) * | 55.625 | 59.320 | 72.497(e) | 74.367(e) | ||||||
(e) stimato
* Il Reddito pro-capite in EURO è calcolato utilizzando il cambio medio annuo
(p): dato parziale
(f): forecast
** Fluid Grade
NOTA: I consumi pro-capite sono ricavati dividendo i consumi totali (Fonte FAS-USDA) per il numero degli abitanti (Fonte FAO)
Fonti:
Area della materia prima: USDA, ERS; Produzione di latte bovino: National Agricultural Statistics Service
Produzioni Lattiero-Casearie: National Agricultural Statistics Service e USDA
Export ed Import: Census Bureau
Consumi: FAS-USDA
PIL e CPI: Intesa Sanpaolo
Reddito pro-capite: International Monetary Found
Popolazione: FAO
Nota: Tasso di Autoapprovvigionamento = Produzioni di Latte/(Consumi apparenti in ME)
Consumi apparenti in ME = Produzioni + Import ME – Export ME
Il Tasso di autoapprovvigionamento non considera il trade di Fat-Filled Milk Powder (FFMP) - HS 190190 e il latte per l'infanzia.
Ultimo aggiornamento: 24-04-2024
* Il Reddito pro-capite in EURO è calcolato utilizzando il cambio medio annuo
(p): dato parziale
(f): forecast
** Fluid Grade
NOTA: I consumi pro-capite sono ricavati dividendo i consumi totali (Fonte FAS-USDA) per il numero degli abitanti (Fonte FAO)
Vedi Metric Conversion Factors
| METRIC CONVERSION FACTORS | ||||
| 1 Hectare = 2.4710 Acres; 1 Kilogram = 2.2046 Pounds | ||||
| 1 Metric Ton | := | Domestic Unit | * | Factor |
| Grano e Soia | := | bushels | * | 0.027216 |
| Riso | := | cwt | * | 0.045359 |
| Colza e semi di girasole | := | cwt | * | 0.045359 |
| Mais, Sorgo e Segale | := | bushels | * | 0.025401 |
| Orzo | := | bushels | * | 0.021772 |
| Avena | := | bushels | * | 0.014515 |
| Zucchero | := | short tons | * | 0.907185 |
| Cotone | := | 480-lb bales | * | 0.217720 |
|
UK cwt: In UK, con il termine CWT si intende il "long hundred weight" (dove long equivale a lordo) pari a 112 libbre, pari a 50.8024 chili. USA cwt : Negli USA con il termine CWT si intende il "short hundred weight" (dove short equivale a netto), pari a 100 libbre, pari a 45.3592 chili. |
||||
Fonti:
Area della materia prima: USDA, ERS; Produzione di latte bovino: National Agricultural Statistics Service
Produzioni Lattiero-Casearie: National Agricultural Statistics Service e USDA
Export ed Import: Census Bureau
Consumi: FAS-USDA
PIL e CPI: Intesa Sanpaolo
Reddito pro-capite: International Monetary Found
Popolazione: FAO
Nota: Tasso di Autoapprovvigionamento = Produzioni di Latte/(Consumi apparenti in ME)
Consumi apparenti in ME = Produzioni + Import ME – Export ME
Il Tasso di autoapprovvigionamento non considera il trade di Fat-Filled Milk Powder (FFMP) - HS 190190 e il latte per l'infanzia.
Ultimo aggiornamento: 24-04-2024
| USA: Export su Produzioni | |||||
| Prodotto | 2021 | 2022 | 2023 | Feb 2024 | Gen-Feb 2024 |
| Burro | 6,1% | 8,8% | 3,9% | 3,0% | 3,0% |
| Formaggio | 6,5% | 7,1% | 6,8% | 8,5% | 7,7% |
| WMP | 58,4% | 62,8% | 52,4% | 51,2% | 39,1% |
| SMP | 90,6% | 89,5% | 90,5% | 81,1% | 73,4% |
| Whey | 111,3% | 127,7% | 94,9% | 66,7% | 59,6% |
| Lattosio | 76,8% | 89,8% | 94,9% | 90,2% | 90,8% |
NOTE:
SMP: Produzione SMP+NDM, Codice Export SMP (040210)
Whey: Produzione Polvere di Siero + WPC (25% - 50%), Codice Export Whey (0404)
Lattosio: Produzione Lattosio, Codice Export Lattosio Alimentare + Farmaceutico (170211+170219)
SMP: Produzione SMP+NDM, Codice Export SMP (040210)
Whey: Produzione Polvere di Siero + WPC (25% - 50%), Codice Export Whey (0404)
Lattosio: Produzione Lattosio, Codice Export Lattosio Alimentare + Farmaceutico (170211+170219)