


.jpg)


.jpg)


US: dairy sector
This page contains data regarding key components of the United States dairy industry over a given time period.
The purpose of this report is two-fold:
- on the one hand, it highlights the complexity of the industry, which should be considered from several viewpoints:
the commodities area, the variety of dairy derivatives, imports, exports and domestic consumption; - on the other hand, it exemplifies the framework of a market that equates large domestic consumption figures (supported by import volumes) to large production figures.
Latest climate weekly reports about precipitations and temperatures.
Total Precipitation: level of rainfall;
Temperature anomalies: variation compared to historical mean temperature;
Min Temperature: minimum temperature;
Max Temperature: maximum temperature;
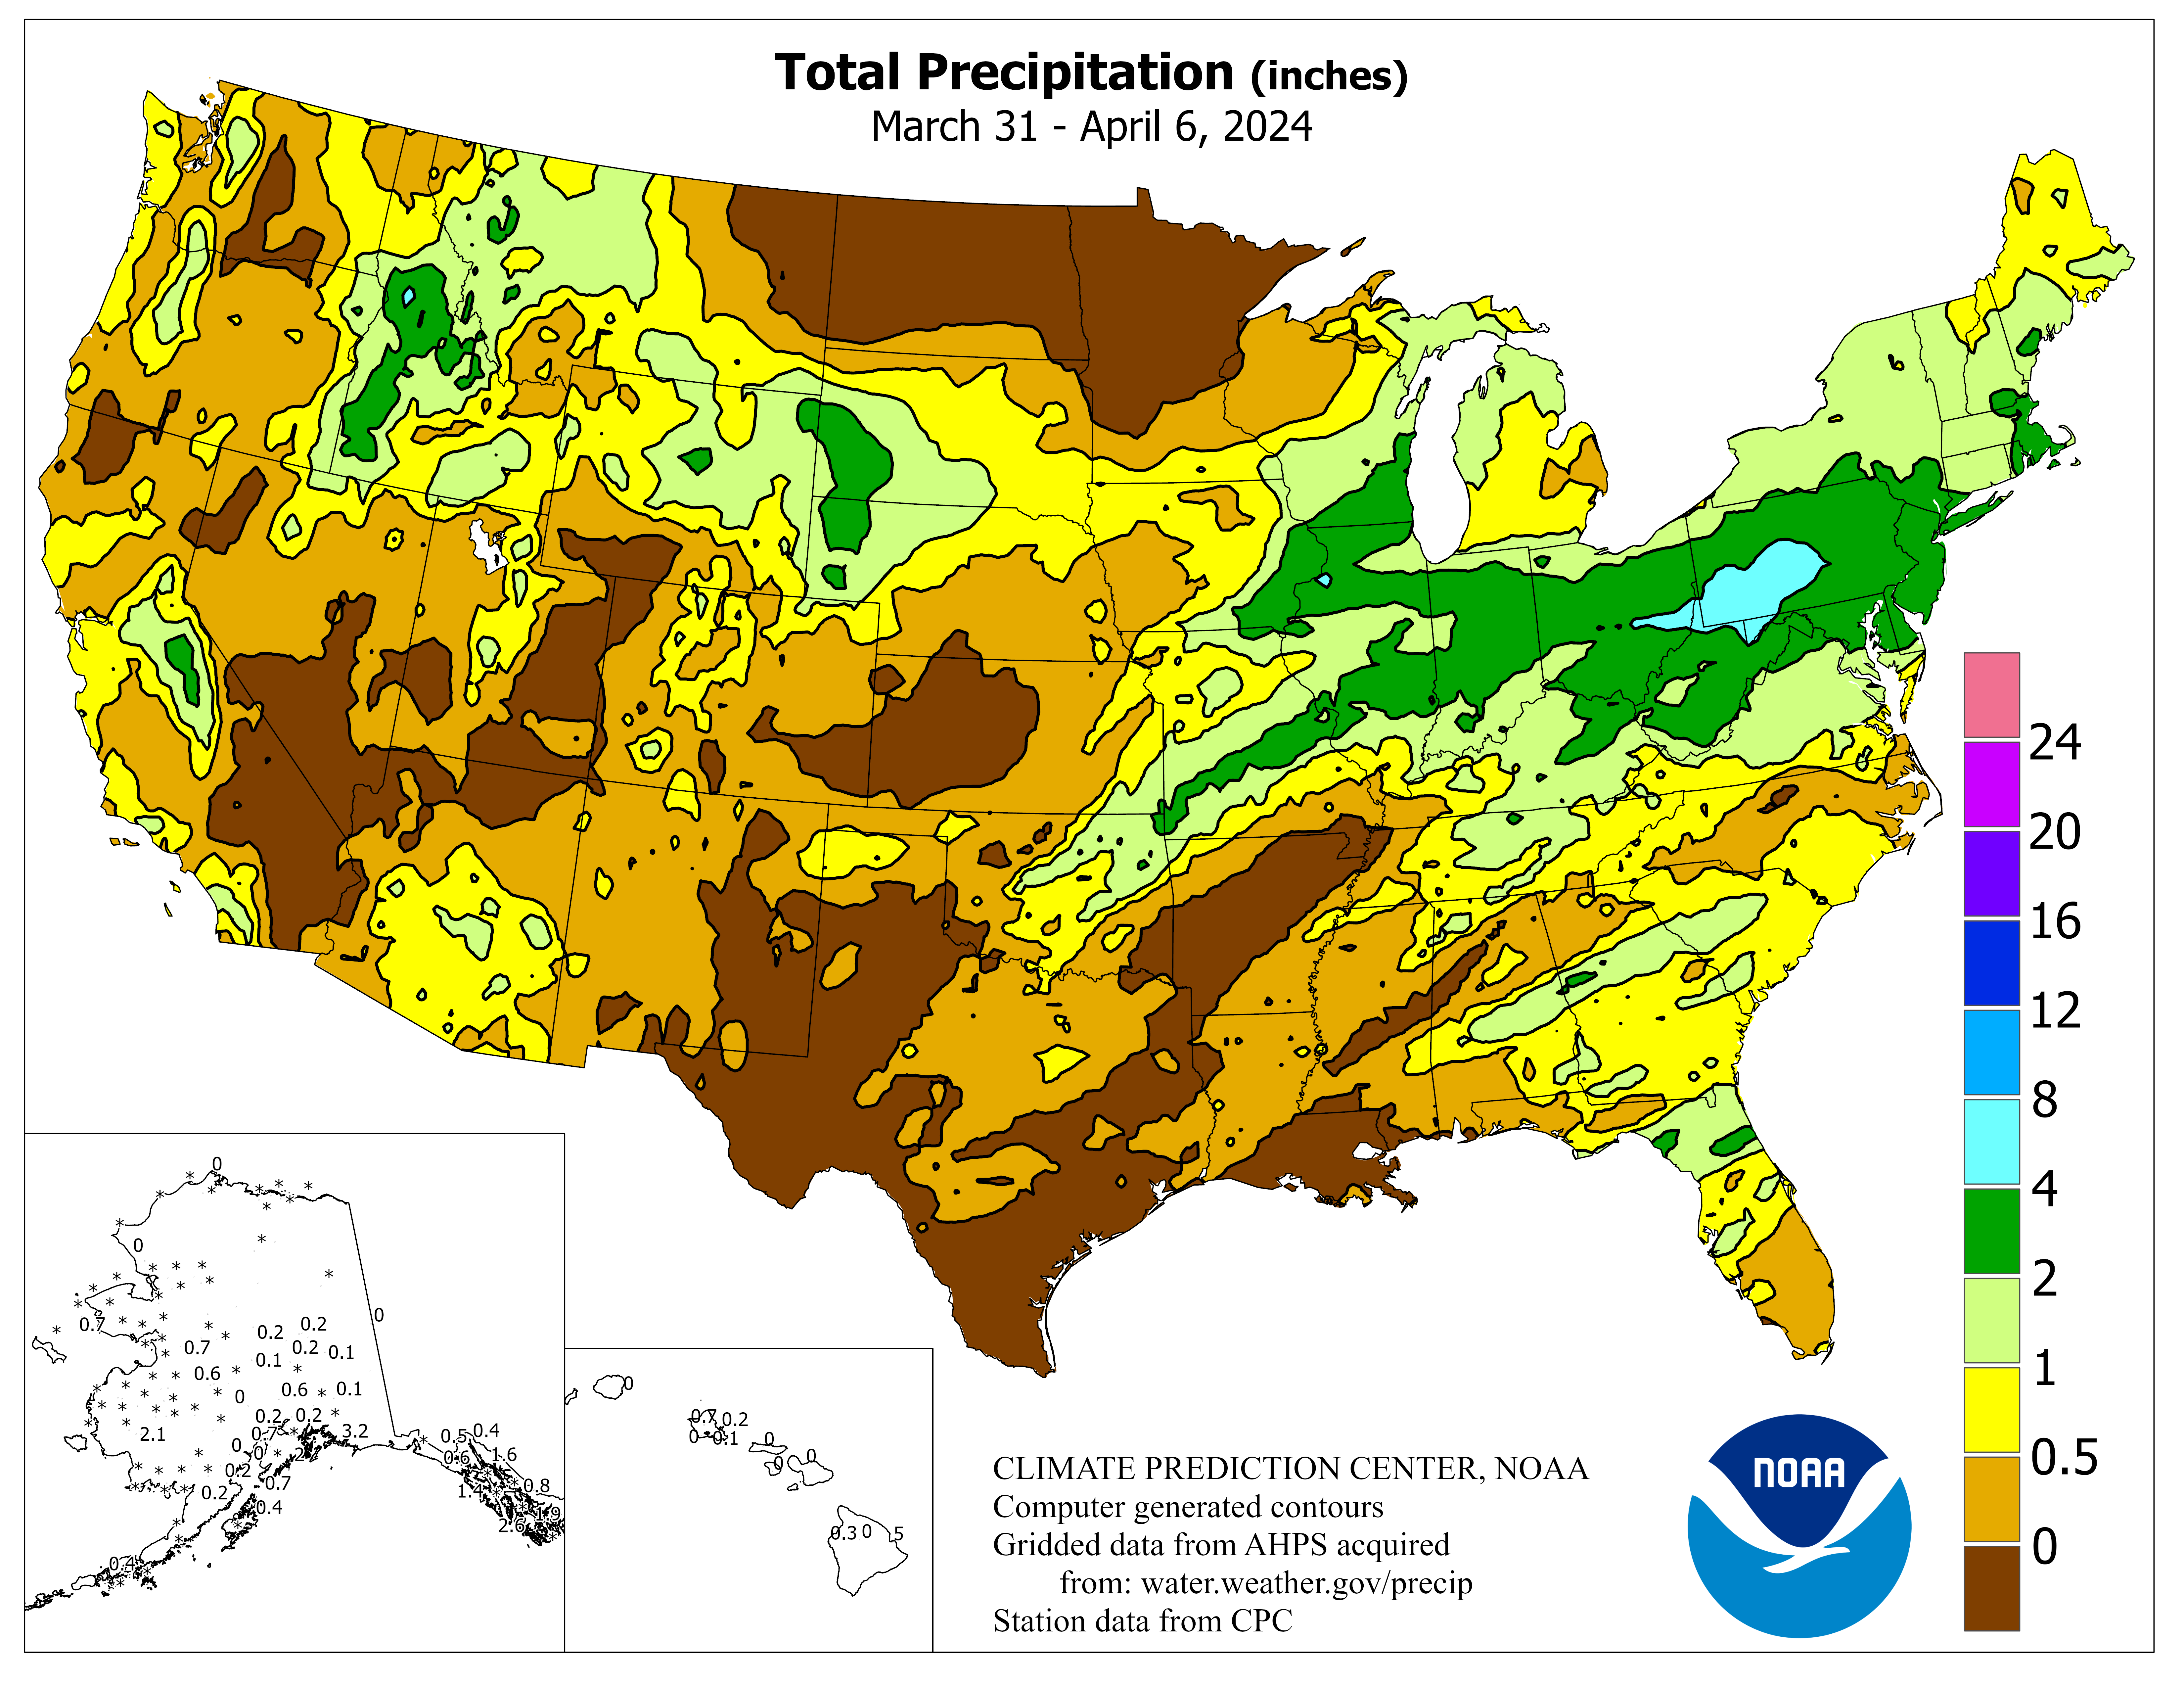
Total Precipitation
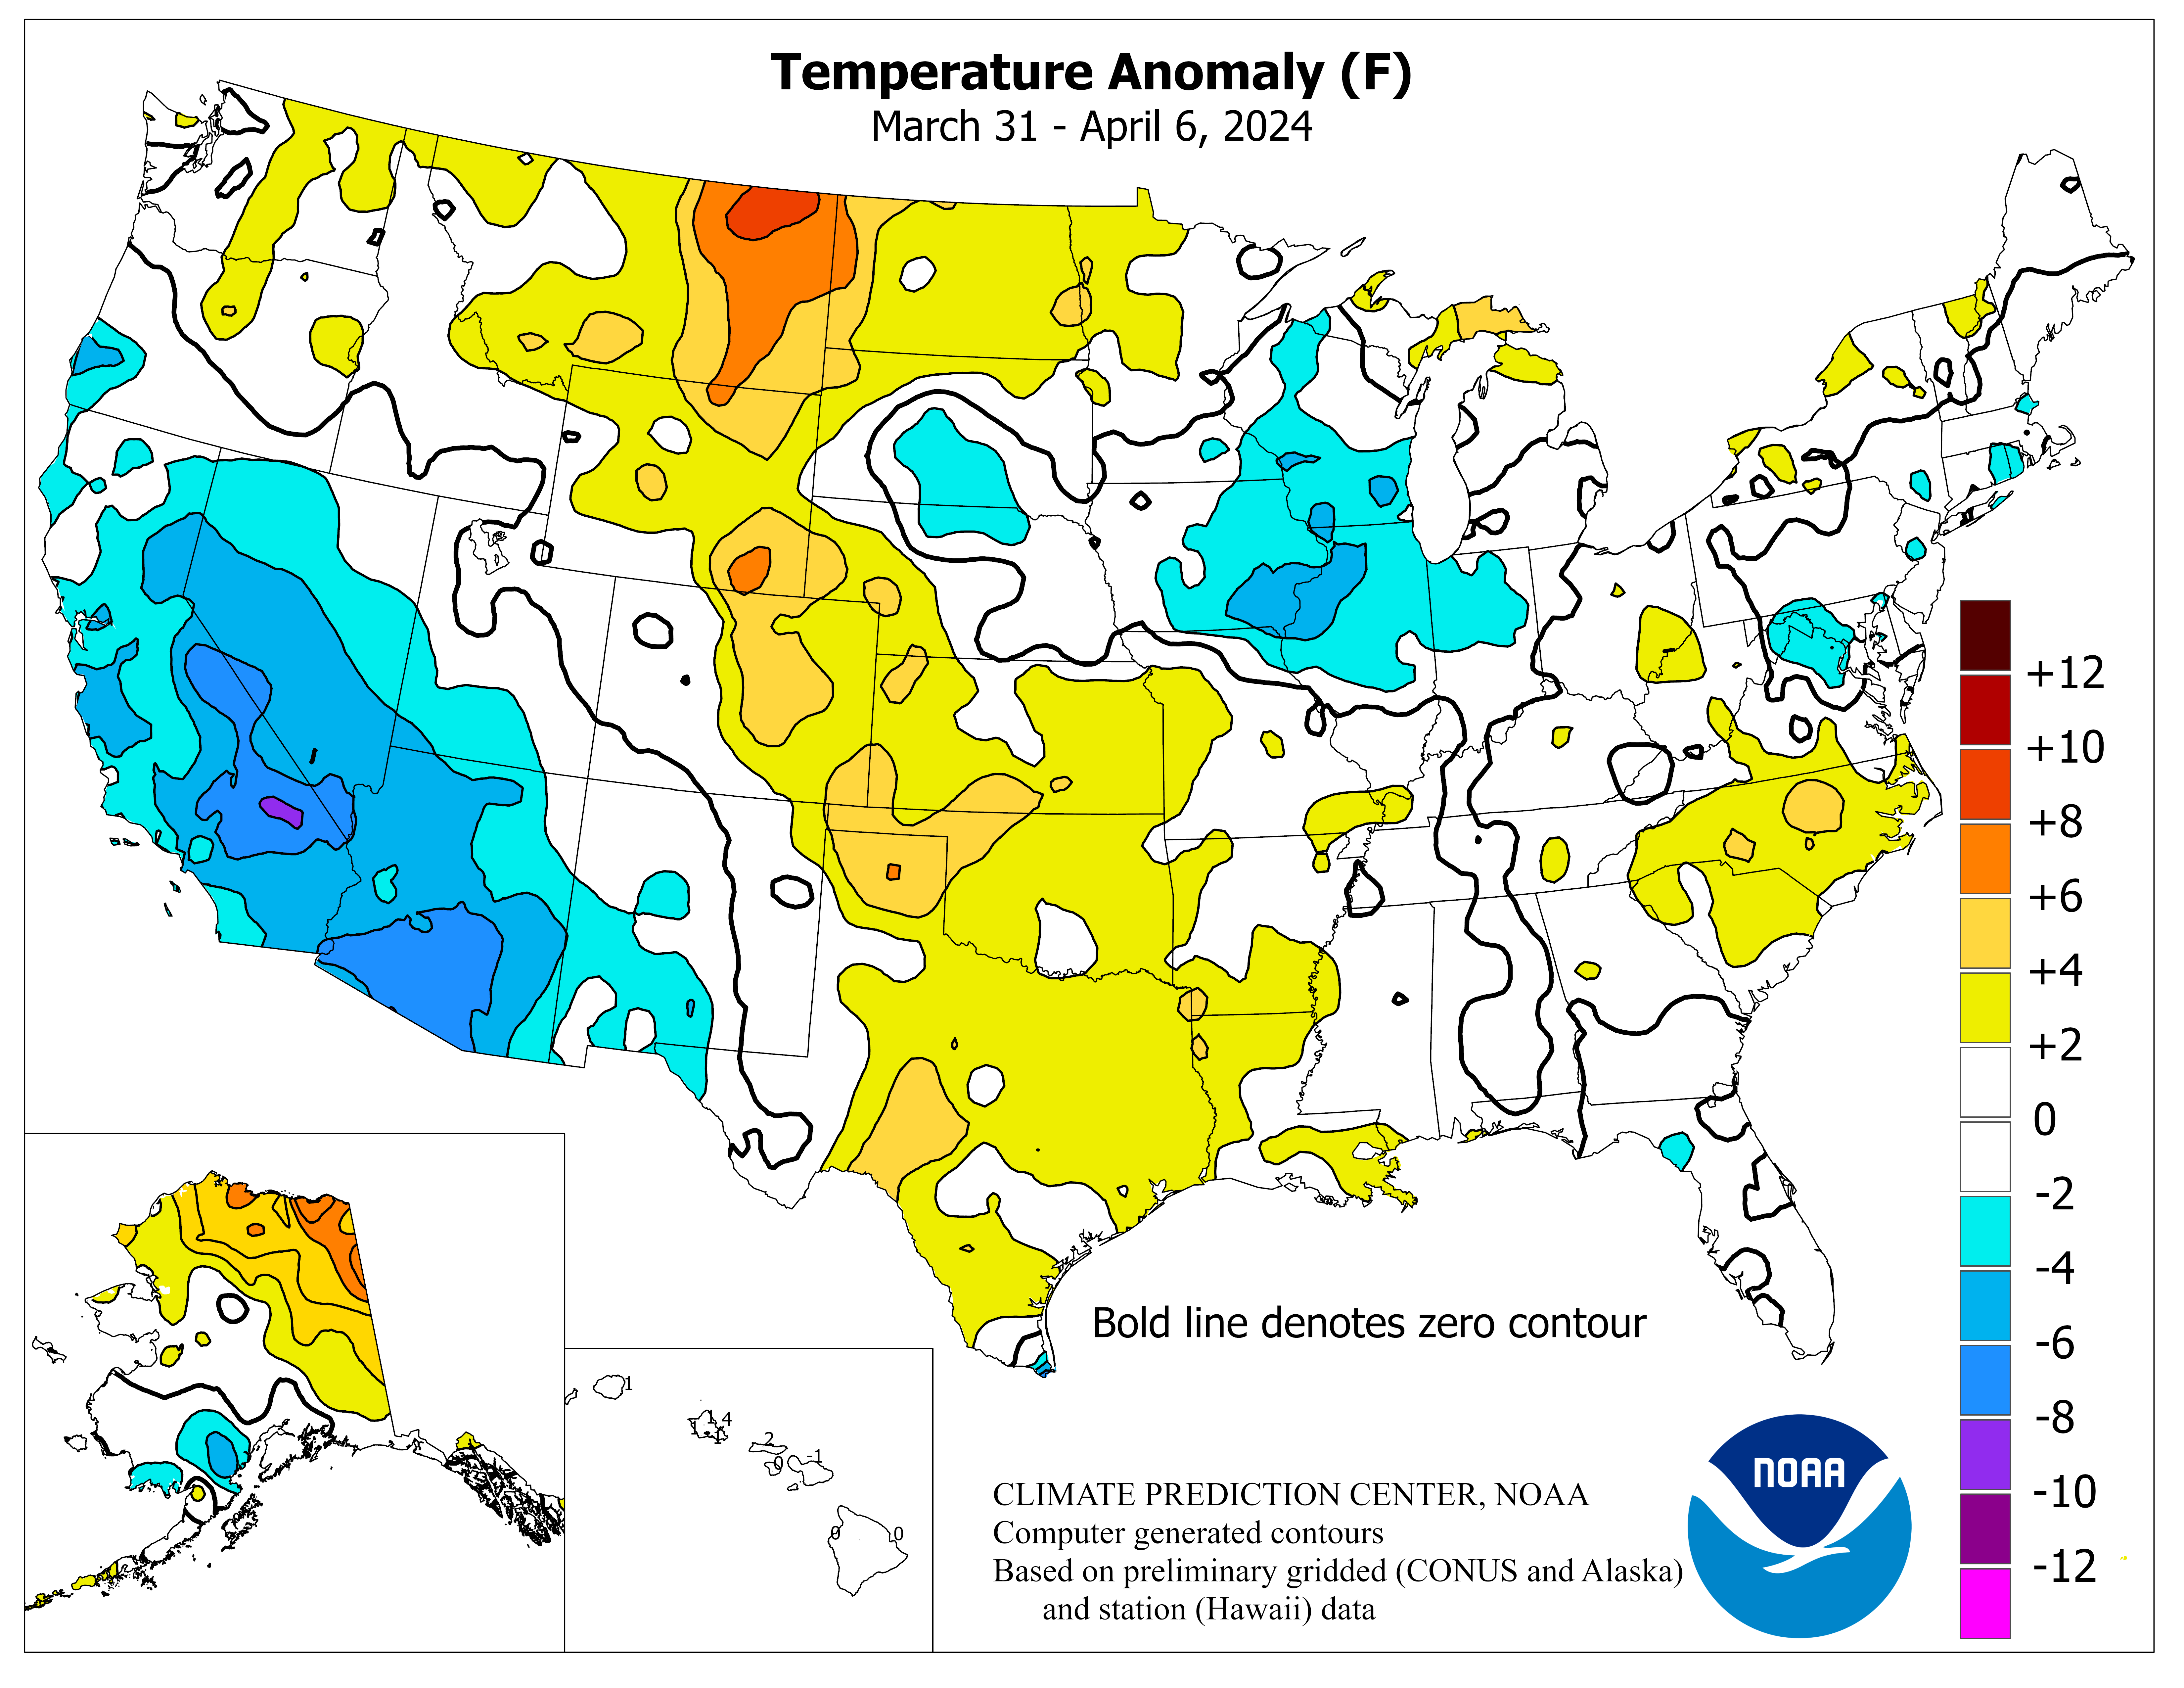
Temperature anomalies
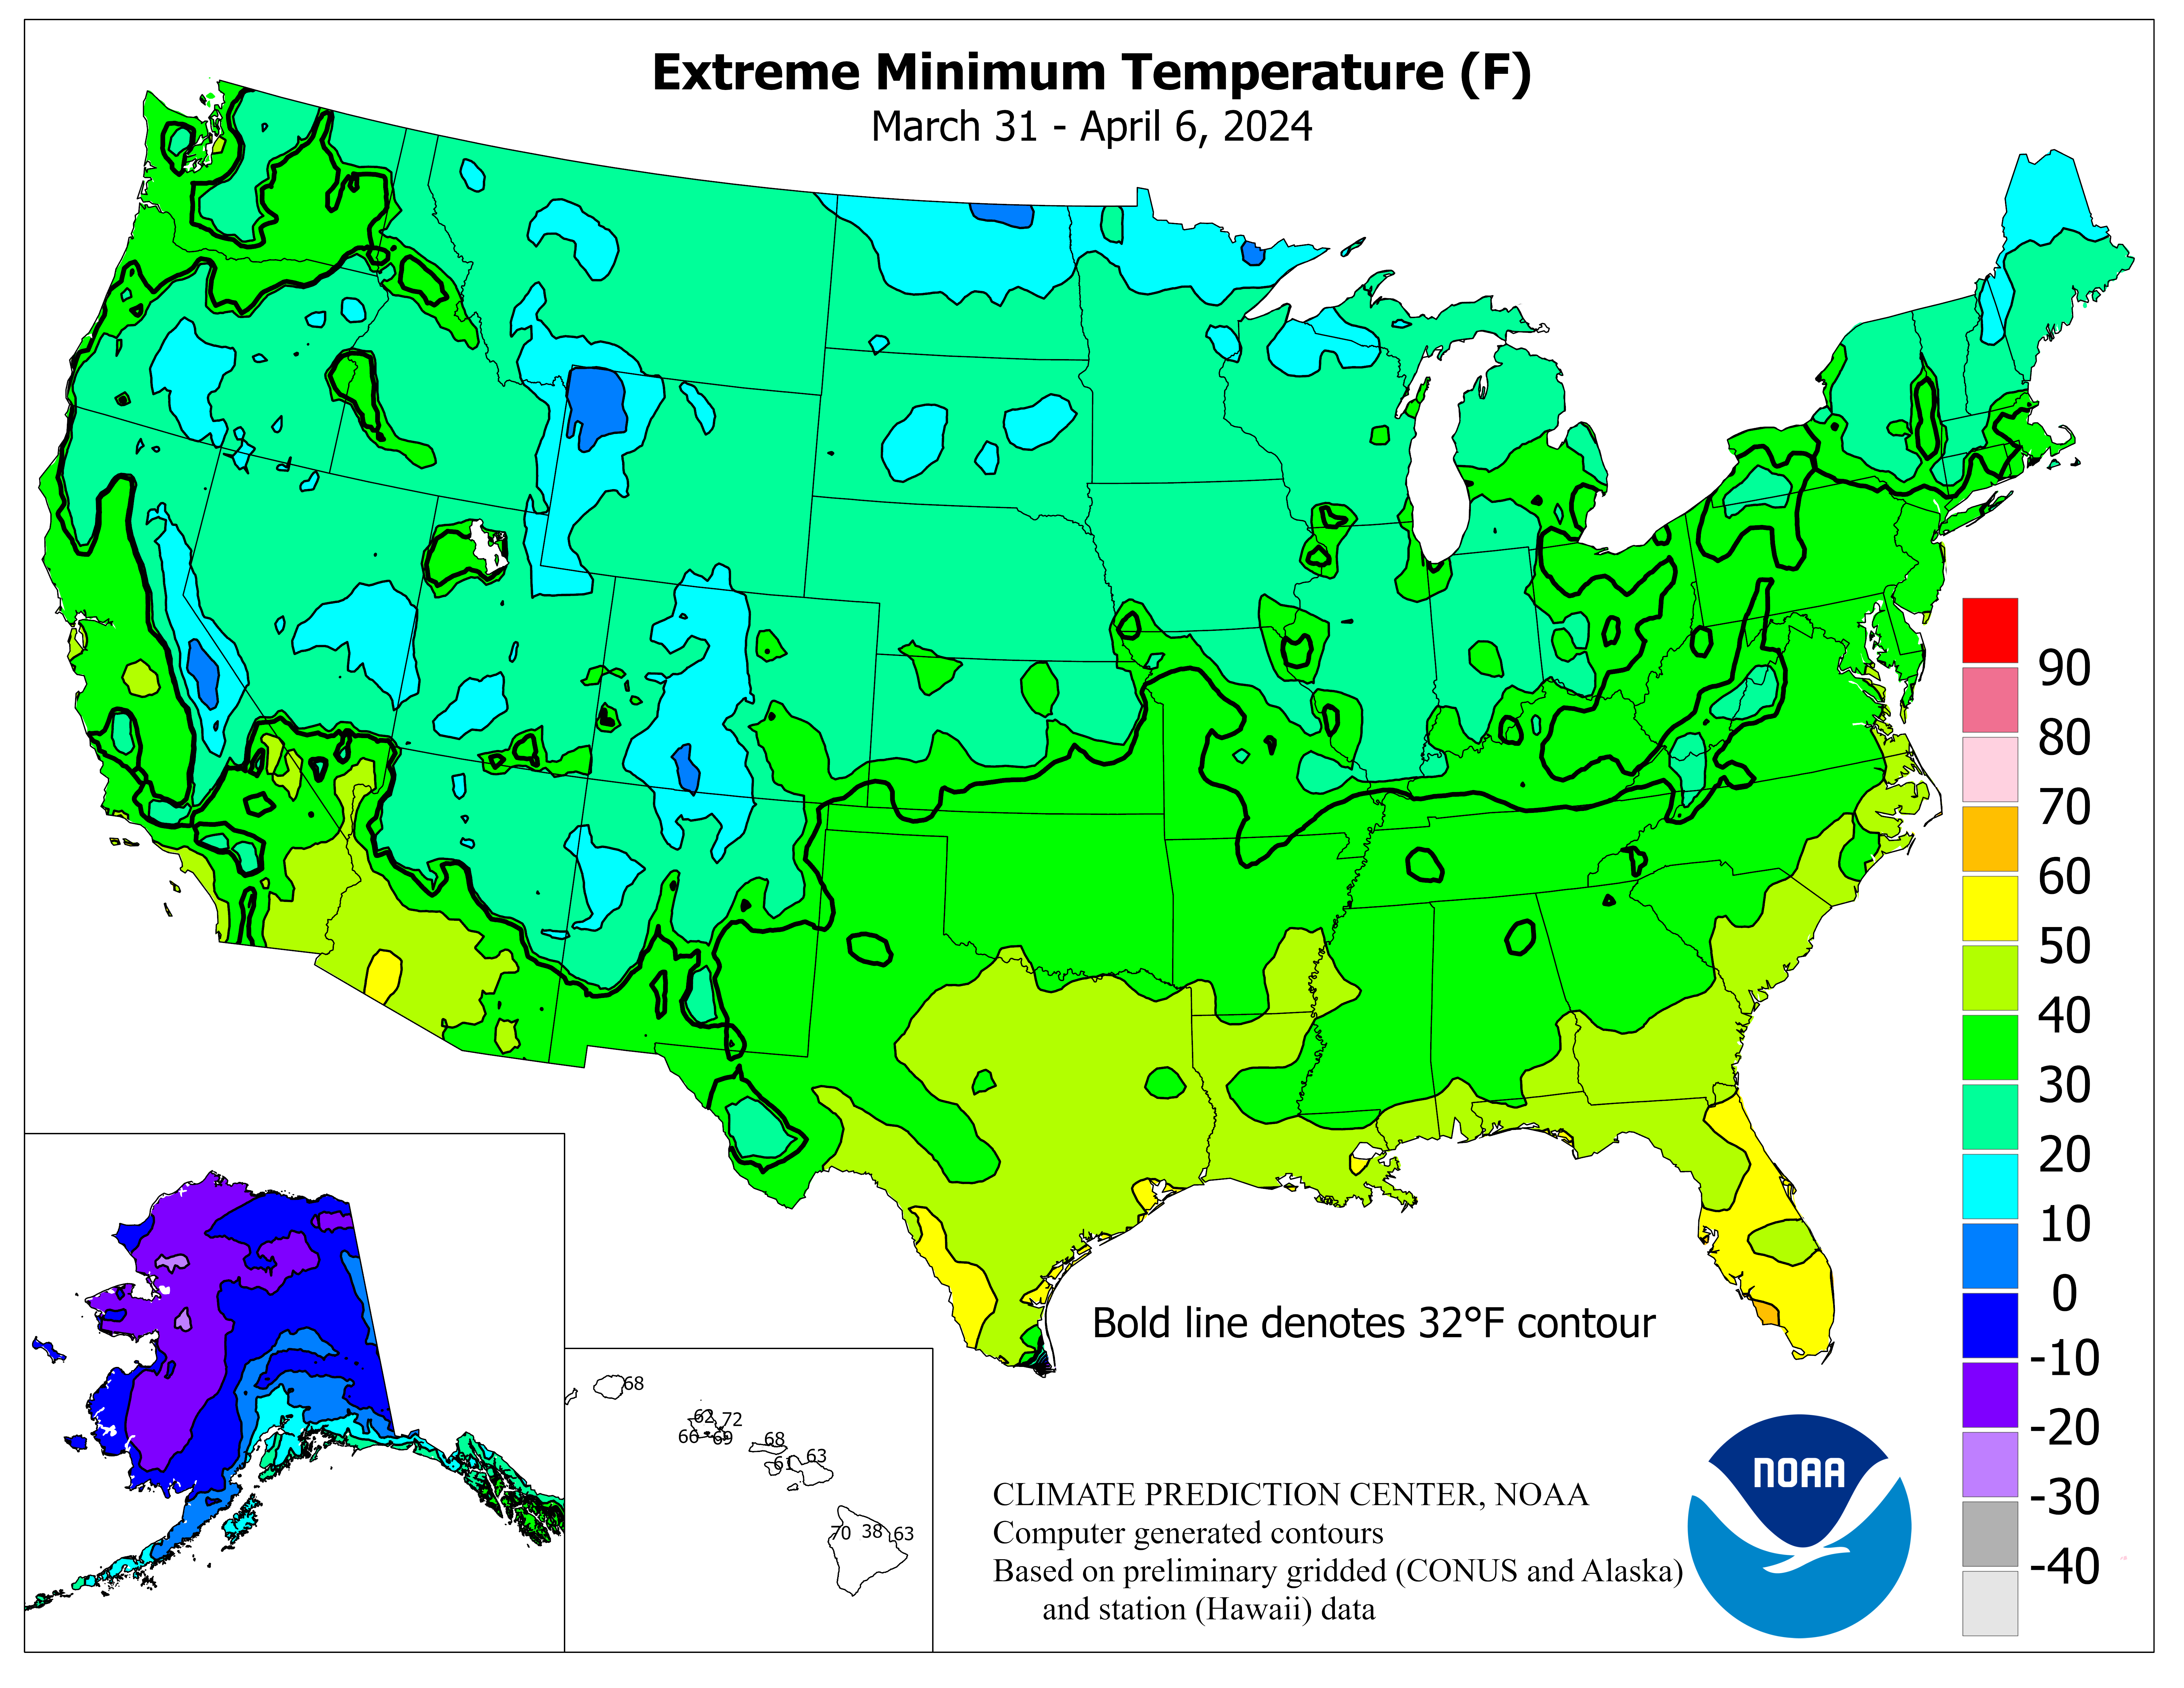
Min Temperature
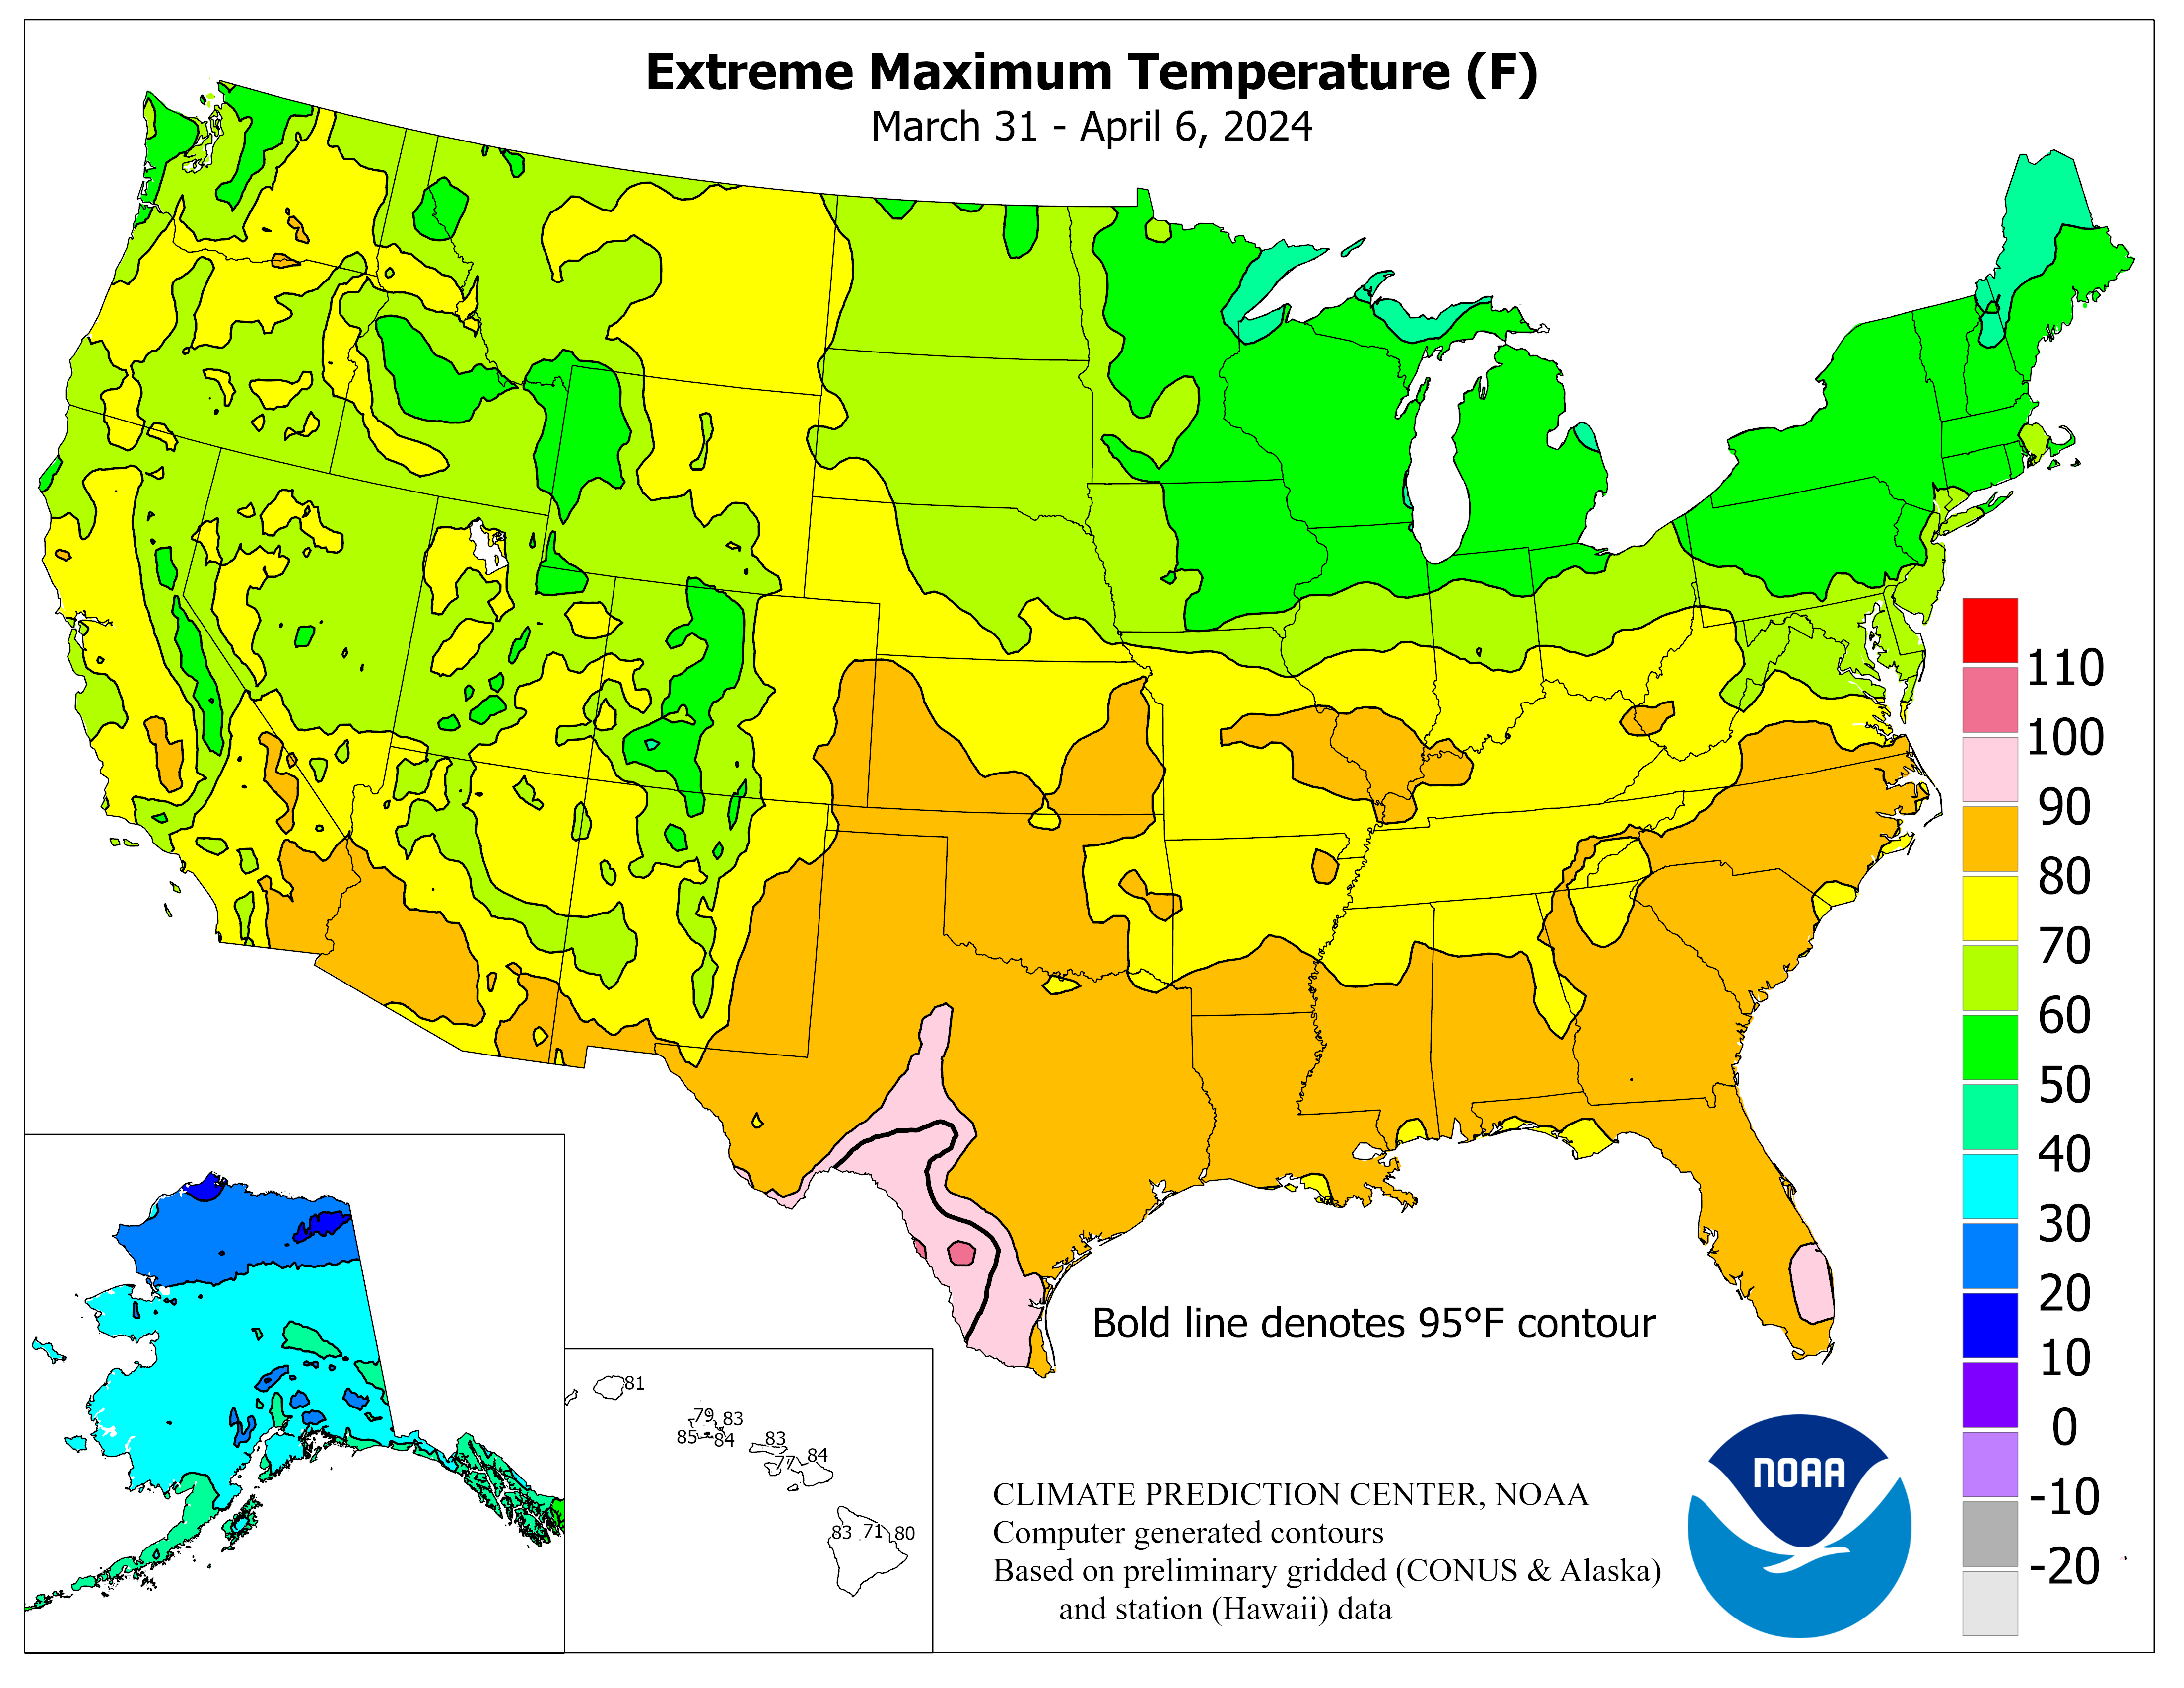
Max Temperature
×
×
×
×
| US: DAIRY SECTOR | ||||||||||
| x 1.000 ton | ||||||||||
| RAW MATERIAL AREA | 2020 | 2021 | 2022 | 2023 | 2023 | 2024 | % | Period | ||
| Farms ('000) | 1.993 | 1.960 | 1.901 | 1.897 | ||||||
| Number of cows ('000 head) | 9.442 | 9.386 | 9.405 | 9.349 | 9.418 | 9.333 | -0,9% | Jan-Mar 2024 | ||
| Cow's milk production | 101.292 | 102.646 | 102.702 | 102.678 | 25.781 | 25.803 | +0,1% | Jan-Mar 2024 | ||
| ± % Over the same period of the previous year | +1,3% | +0,1% | 0,0% | |||||||
| Farm-gate milk price € x 100 Kg ** | 35,00 | 34,59 | 53,13 | 41,76 | 45,87 | 41,35 | -9,8% | Jan-Feb 2024 | ||
| ± % Over the same period of the previous year | -1,2% | +53,6% | -21,4% | |||||||
| Corn price (North West Iowa, IA) (€\Ton) | 116,8 | 194,4 | 267,0 | 214,1 | 252,2 | 157,5 (p) | -37,5% | Jan-Apr 2024 | ||
| Soybeans price (Western Illinois, IL) (€\Ton) | 320,0 | 450,1 | 571,4 | 506,8 | 540,1 | 423,8 (p) | -21,5% | Jan-Apr 2024 | ||
| DAIRY PRODUCTION | 2020 | 2021 | 2022 | 2023 | 2023 | 2024 | % | Period | ||
| Liquid milk | 21.031 | 20.190 | ||||||||
| Butter | 973 | 936 | 934 | 958 | 176 | 188 | +6,8% | Jan-Feb 2024 | ||
| Cream Sour | 663 | 677 | 678 | 684 | 109 | 113 | +4,0% | Jan-Feb 2024 | ||
| Cheese | 6.005 | 6.242 | 6.379 | 6.393 | 1.046 | 1.059 | +1,2% | Jan-Feb 2024 | ||
| Italian Mozzarella | 2.016 | 2.040 | 2.099 | 2.098 | 342 | 350 | +2,3% | Jan-Feb 2024 | ||
| Cheddar | 1.737 | 1.801 | 1.798 | 1.806 | 304 | 288 | -5,3% | Jan-Feb 2024 | ||
| Americal Colby & Jack & Monterey | 685 | 746 | 760 | 785 | 123 | 125 | +1,6% | Jan-Feb 2024 | ||
| Cream & Neufchatel | 459 | 465 | 513 | 510 | 86 | 90 | +5,4% | Jan-Feb 2024 | ||
| Italian Parmesan & Similar | 190 | 220 | 224 | 220 | 38 | 40 | +6,2% | Jan-Feb 2024 | ||
| Italian Provolone & Similar | 166 | 172 | 174 | 168 | 26 | 28 | +8,4% | Jan-Feb 2024 | ||
| Hispanic | 157 | 160 | 175 | 188 | 28 | 33 | +18,4% | Jan-Feb 2024 | ||
| Swiss | 147 | 150 | 159 | 152 | 25 | 25 | -0,8% | Jan-Feb 2024 | ||
| Italian Ricotta & Similar | 115 | 114 | 112 | 112 | 19 | 19 | -0,4% | Jan-Feb 2024 | ||
| Muenster | 85 | 87 | 87 | |||||||
| Feta | 62 | 77 | 64 | 67 | 9,1 | 11 | +18,6% | Jan-Feb 2024 | ||
| Blue e Gorgonzola | 33 | 40 | 42 | 38 | 6,0 | 6,0 | +0,0% | Jan-Feb 2024 | ||
| Italian Romano & Similar | 25 | 31 | 26 | 22 | 3,4 | 4,2 | +24,6% | Jan-Feb 2024 | ||
| Gouda | 20 | 26 | 28 | 28 | 4,6 | 5,0 | +8,7% | Jan-Feb 2024 | ||
| Brick | 0,7 | 0,9 | 0,7 | |||||||
| Altri formaggi | 107 | 114 | 117 | 110 | 17 | 18 | +4,0% | Jan- 2024 | ||
| Cottage Cream | 165 | 154 | 156 | 171 | 26 | 30 | +12,0% | Jan-Feb 2024 | ||
| Cottage Curd | 172 | 163 | 164 | 180 | 28 | 30 | +9,0% | Jan-Feb 2024 | ||
| Cottage Lowfat | 140 | 138 | 133 | 150 | 23 | 26 | +14,4% | Jan-Feb 2024 | ||
| WMP (whole milk powder) | 63 | 67 | 62 | 50 | 8,1 | 9,1 | +12,4% | Jan-Feb 2024 | ||
| NDM (skimmed milk powder) | 885 | 929 | 893 | 853 | 162 | 130 | -20,1% | Jan-Feb 2024 | ||
| SMP (skimmed milk powder) | 315 | 317 | 298 | 252 | 37 | 42 | +13,9% | Jan-Feb 2024 | ||
| Whey powder | 435 | 405 | 415 | 421 | 65 | 68 | +4,4% | Jan-Feb 2024 | ||
| Condensed milk (Whole and Skimmed Canned Milk) | 262 | 249 | 253 | |||||||
| Lactose | 508 | 509 | 504 | 499 | 78 | 80 | +3,1% | Jan-Feb 2024 | ||
| WPC (Whey Protein Concentrate) | 217 | 210 | 205 | 224 | 36 | 37 | +3,5% | Jan-Feb 2024 | ||
| WPI 90 (Whey Protein Isolated) | 51 | 59 | 59 | 54 | 7,9 | 13 | +66,2% | Jan-Feb 2024 | ||
| Yogurt | 2.046 | 2.152 | 2.097 | 2.154 | 359 | 361 | +0,6% | Jan-Feb 2024 | ||
| Frozen Yogurt (Mio Litri) | 133 | 153 | 173 | 173 | 30 | 28 | -5,1% | Jan-Feb 2024 | ||
| Ice cream, regular, hard (Mio Litri) | 2.903 | 2.726 | 2.751 | 2.706 | 421 | 391 | -7,3% | Jan-Feb 2024 | ||
| Ice cream lowfat, total (Mio Litri) | 1.752 | 1.808 | 1.690 | 1.591 | 231 | 214 | -7,0% | Jan-Feb 2024 | ||
| Ice cream, lowfat, hard (Mio Litri) | 949 | 865 | 828 | 841 | 123 | 108 | -12,3% | Jan-Feb 2024 | ||
| Ice cream, lowfat, soft (Mio Litri) | 803 | 943 | 861 | 750 | 108 | 107 | -0,9% | Jan-Feb 2024 | ||
| Ice cream, nonfat, hard (Mio Litri) | 21 | 25 | 28 | 31 | 4,0 | 3,8 | -6,8% | Jan-Feb 2024 | ||
| EXPORT | 2020 | 2021 | 2022 | 2023 | 2023 | 2024 | % | Period | ||
| Bulk and pack. milk (HS 040110+040120) |
|
106 | 120 | 120 | 102 | 17 | 16 | -5,8% | Jan-Feb 2024 | |
| Cream (HS 040130+040140+040150) |
|
24 | 26 | 28 | 37 | 4,5 | 5,4 | +18,4% | Jan-Feb 2024 | |
| Condensed milk (HS 040291+040299) |
|
11 | 16 | 20 | 22 | 2,9 | 2,9 | -1,2% | Jan-Feb 2024 | |
| Butter (HS 0405) |
|
27 | 57 | 82 | 37 | 8,1 | 5,7 | -29,9% | Jan-Feb 2024 | |
| of which: | ||||||||||
| Anhydrous Milk Fat (HS 040590) |
|
5,1 | 13 | 16 | 6,1 | 1,2 | 1,0 | -17,1% | Jan-Feb 2024 | |
| Cheese (HS 0406) |
|
358 | 404 | 454 | 438 | 67 | 82 | +22,2% | Jan-Feb 2024 | |
| SMP (skimmed milk powder - HS 040210) |
|
816 | 880 | 837 | 810 | 131 | 126 | -3,9% | Jan-Feb 2024 | |
| WMP (whole milk powder - HS 040221+040229) |
|
39 | 39 | 39 | 26 | 3,1 | 3,5 | +15,7% | Jan-Feb 2024 | |
| Whey powder (HS 0404) |
|
546 | 592 | 663 | 534 | 87 | 89 | +2,5% | Jan-Feb 2024 | |
| of which: | ||||||||||
| Sweet dairy Whey (12% protein) e WPC (HS 040410) |
|
504 | 551 | 615 | 490 | 80 | 82 | +2,7% | Jan-Feb 2024 | |
| Casein (HS 350110) |
|
1,9 | 1,8 | 2,1 | 1,1 | 0,2 | 0,5 | +180,6% | Jan-Feb 2024 | |
| Caseinates (HS 350190) |
|
1,6 | 2,1 | 2,5 | 2,6 | 0,4 | 0,5 | +48,3% | Jan-Feb 2024 | |
| Lactose pharmaceutical (HS 170211) |
|
304 | 322 | 413 | 436 | 71 | 69 | -1,9% | Jan-Feb 2024 | |
| Lactose edible (HS 170299) |
|
75 | 69 | 40 | 37 | 5,8 | 3,4 | -41,1% | Jan-Feb 2024 | |
| Infant milk formula (HS 190110) |
|
32 | 28 | 29 | 28 | 3,5 | 4,3 | +21,2% | Jan-Feb 2024 | |
| Yogurt e latticello (HS 0403) |
|
37 | 41 | 41 | 48 | 6,9 | 8,7 | +26,4% | Jan-Feb 2024 | |
| Fat-Filled Milk Powder (FFMP) (HS 190190) |
|
173 | 162 | 176 | 178 | 32 | 26 | -19,8% | Jan-Feb 2024 | |
| Whey Protein Isolate (WPI) (HS 350220) |
|
59 | 65 | 65 | 76 | 10 | 12 | +18,5% | Jan-Feb 2024 | |
| IMPORT | 2020 | 2021 | 2022 | 2023 | 2023 | 2024 | % | Period | ||
| Bulk and pack. milk (HS 040110+040120) |
|
33 | 35 | 26 | 24 | 4,2 | 4,0 | -5,0% | Jan-Feb 2024 | |
| Cream (HS 040130+040140+040150) |
|
25 | 19 | 32 | 58 | 5,7 | 8,2 | +42,6% | Jan-Feb 2024 | |
| Condensed milk (HS 040291+040299) |
|
26 | 23 | 37 | 37 | 5,5 | 8,7 | +59,4% | Jan-Feb 2024 | |
| Butter (HS 0405) |
|
69 | 63 | 73 | 81 | 13 | 16 | +20,0% | Jan-Feb 2024 | |
| of which: | ||||||||||
| Anhydrous Milk Fat (HS 040590) |
|
27 | 14 | 21 | 19 | 4,1 | 3,7 | -8,1% | Jan-Feb 2024 | |
| Cheese (HS 0406) |
|
165 | 188 | 189 | 194 | 27 | 31 | +15,2% | Jan-Feb 2024 | |
| SMP (skimmed milk powder - HS 040210) |
|
0,7 | 0,4 | 0,6 | 0,8 | 0,0 | 0,0 | +40,4% | Jan-Feb 2024 | |
| WMP (whole milk powder - HS 040221+040229) |
|
23 | 12 | 16 | 14 | 2,5 | 2,5 | -2,5% | Jan-Feb 2024 | |
| Whey powder (HS 0404) |
|
84 | 84 | 79 | 81 | 16 | 12 | -25,0% | Jan-Feb 2024 | |
| of which: | ||||||||||
| Sweet dairy Whey (12% protein) e WPC (HS 040410) |
|
41 | 44 | 44 | 44 | 8,3 | 7,3 | -11,6% | Jan-Feb 2024 | |
| Casein (HS 350110) |
|
46 | 53 | 81 | 51 | 16 | 8,7 | -45,6% | Jan-Feb 2024 | |
| Caseinates (HS 350190) |
|
21 | 22 | 24 | 31 | 6,3 | 3,3 | -48,3% | Jan-Feb 2024 | |
| Lactose pharmaceutical (HS 170211) |
|
2,7 | 2,9 | 3,2 | 3,3 | 0,5 | 0,4 | -28,7% | Jan-Feb 2024 | |
| Lactose edible (HS 170299) |
|
0,5 | 0,4 | 0,5 | 0,8 | 0,1 | 0,1 | -35,9% | Jan-Feb 2024 | |
| Infant milk formula (HS 190110) |
|
9,3 | 17 | 42 | 40 | 5,6 | 13 | +138,5% | Jan-Feb 2024 | |
| Yogurt e latticello (HS 0403) |
|
25 | 27 | 35 | 41 | 6,5 | 7,8 | +20,4% | Jan-Feb 2024 | |
| Fat-Filled Milk Powder (FFMP) (HS 190190) |
|
195 | 230 | 255 | 252 | 41 | 41 | +0,2% | Jan-Feb 2024 | |
| Whey Protein Isolate (WPI) (HS 350220) |
|
8,5 | 14 | 11 | 9,9 | 1,4 | 3,3 | +146,2% | Jan-Feb 2024 | |
| STOCK (al 31 December) | 2020 | 2021 | 2022 | 2023 | 2023 | 2024 | % | Period | ||
| Butter | 124 | 90 | 98 | 91 | 140 | 144 | +2,3% | Mar 2024 | ||
| Cheese (no fresh cheese) | 633 | 654 | 656 | 654 | 662 | 662 | -0,1% | Mar 2024 | ||
| SMP Human Use | 131 | 115 | 116 | 92 | 143 | 95 | -33,6% | Feb 2024 | ||
| SMP Animal Use | 3,9 | 2,7 | 3,7 | 2,9 | 4,6 | 3,6 | -21,5% | Feb 2024 | ||
| WMP (Whole Milk Powder) | 7,7 | 11 | 6,9 | 5,9 | 7,6 | 5,5 | -27,4% | Feb 2024 | ||
| Condensed milk (Whole and Skimmed Canned Milk) | 16 | 21 | 18 | |||||||
| Whey Powder Human Use | 29 | 25 | 31 | 30 | 30 | 30 | +2,2% | Feb 2024 | ||
| Whey Powder Animal Use | 0,3 | 0,3 | 0,6 | 1,8 | 1,6 | 2,7 | +71,0% | Feb 2024 | ||
| WPC | 29 | 31 | 37 | 28 | 39 | 26 | -33,2% | Feb 2024 | ||
| I° Classification | ||||||||||
| - WPC Human Use | 28 | 30 | 37 | 27 | 39 | 26 | -34,1% | Feb 2024 | ||
| - WPC Animal Use | 0,4 | 0,7 | 0,4 | 0,8 | 0,4 | 0,6 | +50,5% | Feb 2024 | ||
| 2° Classification | ||||||||||
| - WPC 25-49.9% s.s. | 12 | 11 | 13 | 11 | 14 | 10 | -29,6% | Feb 2024 | ||
| - WPC 50-89.9% s.s. | 16 | 21 | 24 | 16 | 25 | 16 | -35,2% | Feb 2024 | ||
| Lactose | 56 | 76 | 78 | 48 | 75 | 49 | -35,1% | Feb 2024 | ||
| DOMESTIC CONSUMPTION (Source: FAS-USDA) | 2020 | 2021 | 2022 | 2023 | 2023 | 2024(f) | % | Period | ||
| Cheese | 5.745 | 5.964 | 6.055 | 6.106 | 6.106 | 6.231 | +2,0% | Jan-Dec 2024 | Butter | 978 | 981 | 924 | 1.004 | 1.004 | 1.009 | +0,5% | Jan-Dec 2024 | SMP | 384 | 374 | 366 | 324 | 324 | 391 | +20,7% | Jan-Dec 2024 | WMP | 34 | 33 | 40 | 33 | 33 | 25 | -24,2% | Jan-Dec 2024 |
| PER CAPITA CONSUMPTIONS (kg) | 2020 | 2021 | 2022 | 2023 | 2023 | 2024(f) | % | Period | ||
| Cheese | 17,10 | 17,70 | 17,90 | 17,96 | ||||||
| Butter | 2,91 | 2,91 | 2,73 | 2,95 | ||||||
| SMP | 1,14 | 1,11 | 1,08 | 0,95 | ||||||
| WMP | 0,10 | 0,10 | 0,12 | 0,10 | ||||||
| % Self-sufficiency | 100,1% | 100,1% | 100,1% | 100,1% | ||||||
| SOCIO-ECONOMIC INDICATORS | 2020 | 2021 | 2022 | 2023 | 2023 | 2024(f) | % | Period | ||
| GDP (gross domestic product) | -2,21% | 5,80% | 1,94% | 2,53% | 2,53% | 2,30% | Jan-Dic 2024 | |||
| CPI (consumer price index) | 1,23% | 4,70% | 8,00% | 4,12% | 4,12% | 2,70% | Jan-Dic 2024 | |||
| Population ('000) | 335.942 | 336.998 | 338.290 | 339.997 | ||||||
| GDP per capita (U.S. dollars) | 63.577 | 70.160 | 76.343 (e) | 80.412 (e) | ||||||
| GDP per capita (€) * | 55.625 | 59.320 | 72.497(e) | 74.367(e) | ||||||
(e) estimated
* Per capita GDP in Euro is calculated by using the yearly average exchange rate
(p): partial data
(f): forecast
** Fluid Grade
NOTE:Per capita consumptions are obtained dividing total consumption (Source FAS-USDA ) by the population (Source FAO)
Source:
Raw material area: USDA, ERS; Cow's milk production: National Agricultural Statistics Service
Dairy production: National Agricultural Statistics Service and USDA
Export and Import: Census Bureau
Consumption: FAS-USDA
GDP and CPI: Intesa Sanpaolo
GDP per capita: International Monetary Found
Population: FAO
Note: Self-sufficiency rate = Milk deliveries/(Domestic use in milk equivalent ME)
Domestic use in milk equivalent (ME) = Milk deliveries + Import in ME - Export in ME
The Self-sufficiency rate does not consider the trade of FFMP (fat-filled milk powder) - HS 190190 and the infant milk formula.
Last update: 2024-04-24
* Per capita GDP in Euro is calculated by using the yearly average exchange rate
(p): partial data
(f): forecast
** Fluid Grade
NOTE:Per capita consumptions are obtained dividing total consumption (Source FAS-USDA ) by the population (Source FAO)
Vedi Metric Conversion Factors
| METRIC CONVERSION FACTORS | ||||
| 1 Hectare = 2.4710 Acres; 1 Kilogram = 2.2046 Pounds | ||||
| 1 Metric Ton | := | Domestic Unit | * | Factor |
| Wheat & Soybeans | := | bushels | * | 0.027216 |
| Rice | := | cwt | * | 0.045359 |
| Rapeseed & Sunflowerseed | := | cwt | * | 0.045359 |
| Corn, Sorghum & Rye | := | bushels | * | 0.025401 |
| Barley | := | bushels | * | 0.021772 |
| Oats | := | bushels | * | 0.014515 |
| Sugar | := | short tons | * | 0.907185 |
| Cotton | := | 480-lb bales | * | 0.217720 |
|
UK cwt: in UK CWT is "long hundred weight" (long is equivalent to gross) = 112 lbs, that equals to 50.8024 Kg. USA cwt : in USA CWT is "short hundred weight" (short is equivalent to net)=100 lbs, that equals to 45.3592 Kg. |
||||
Source:
Raw material area: USDA, ERS; Cow's milk production: National Agricultural Statistics Service
Dairy production: National Agricultural Statistics Service and USDA
Export and Import: Census Bureau
Consumption: FAS-USDA
GDP and CPI: Intesa Sanpaolo
GDP per capita: International Monetary Found
Population: FAO
Note: Self-sufficiency rate = Milk deliveries/(Domestic use in milk equivalent ME)
Domestic use in milk equivalent (ME) = Milk deliveries + Import in ME - Export in ME
The Self-sufficiency rate does not consider the trade of FFMP (fat-filled milk powder) - HS 190190 and the infant milk formula.
Last update: 2024-04-24
| US: Export on Production | |||||
| Product | 2021 | 2022 | 2023 | Feb 2024 | Jan-Feb 2024 |
| Butter | 6,1% | 8,8% | 3,9% | 3,0% | 3,0% |
| Cheese | 6,5% | 7,1% | 6,8% | 8,5% | 7,7% |
| WMP | 58,4% | 62,8% | 52,4% | 51,2% | 39,1% |
| SMP | 90,6% | 89,5% | 90,5% | 81,1% | 73,4% |
| Whey | 111,3% | 127,7% | 94,9% | 66,7% | 59,6% |
| Lactose | 76,8% | 89,8% | 94,9% | 90,2% | 90,8% |
NOTE:
SMP: SMP+NDM Production, SMP (040210) Export Code
Whey: Whey + WPC (25% - 50%) Production, Whey (0404) Export Code
Lactose: Lactose Production, Lactose edible + pharmaceutical (170211+170219) Export Code
SMP: SMP+NDM Production, SMP (040210) Export Code
Whey: Whey + WPC (25% - 50%) Production, Whey (0404) Export Code
Lactose: Lactose Production, Lactose edible + pharmaceutical (170211+170219) Export Code