


.jpg)


.jpg)


Croatia: Dairy sector
This Country:
- accounts for 0,3% of EU milk deliveries (year 2023),
- exports dairy products, converted into milk equivalent (ME), for the 30,1% of the milk deliveries (year 2022),
- accounts for 0,1% of EU dairy exports in ME (year 2023).
The orange links allow a further analysis on TESEO.
![]()
![]()
![]()
![]()
Latest climate weekly reports about precipitations and temperatures.
Total Precipitation: level of rainfall;
Temperature anomalies: variation compared to historical mean temperature;
Min Temperature: minimum temperature;
Max Temperature: maximum temperature;
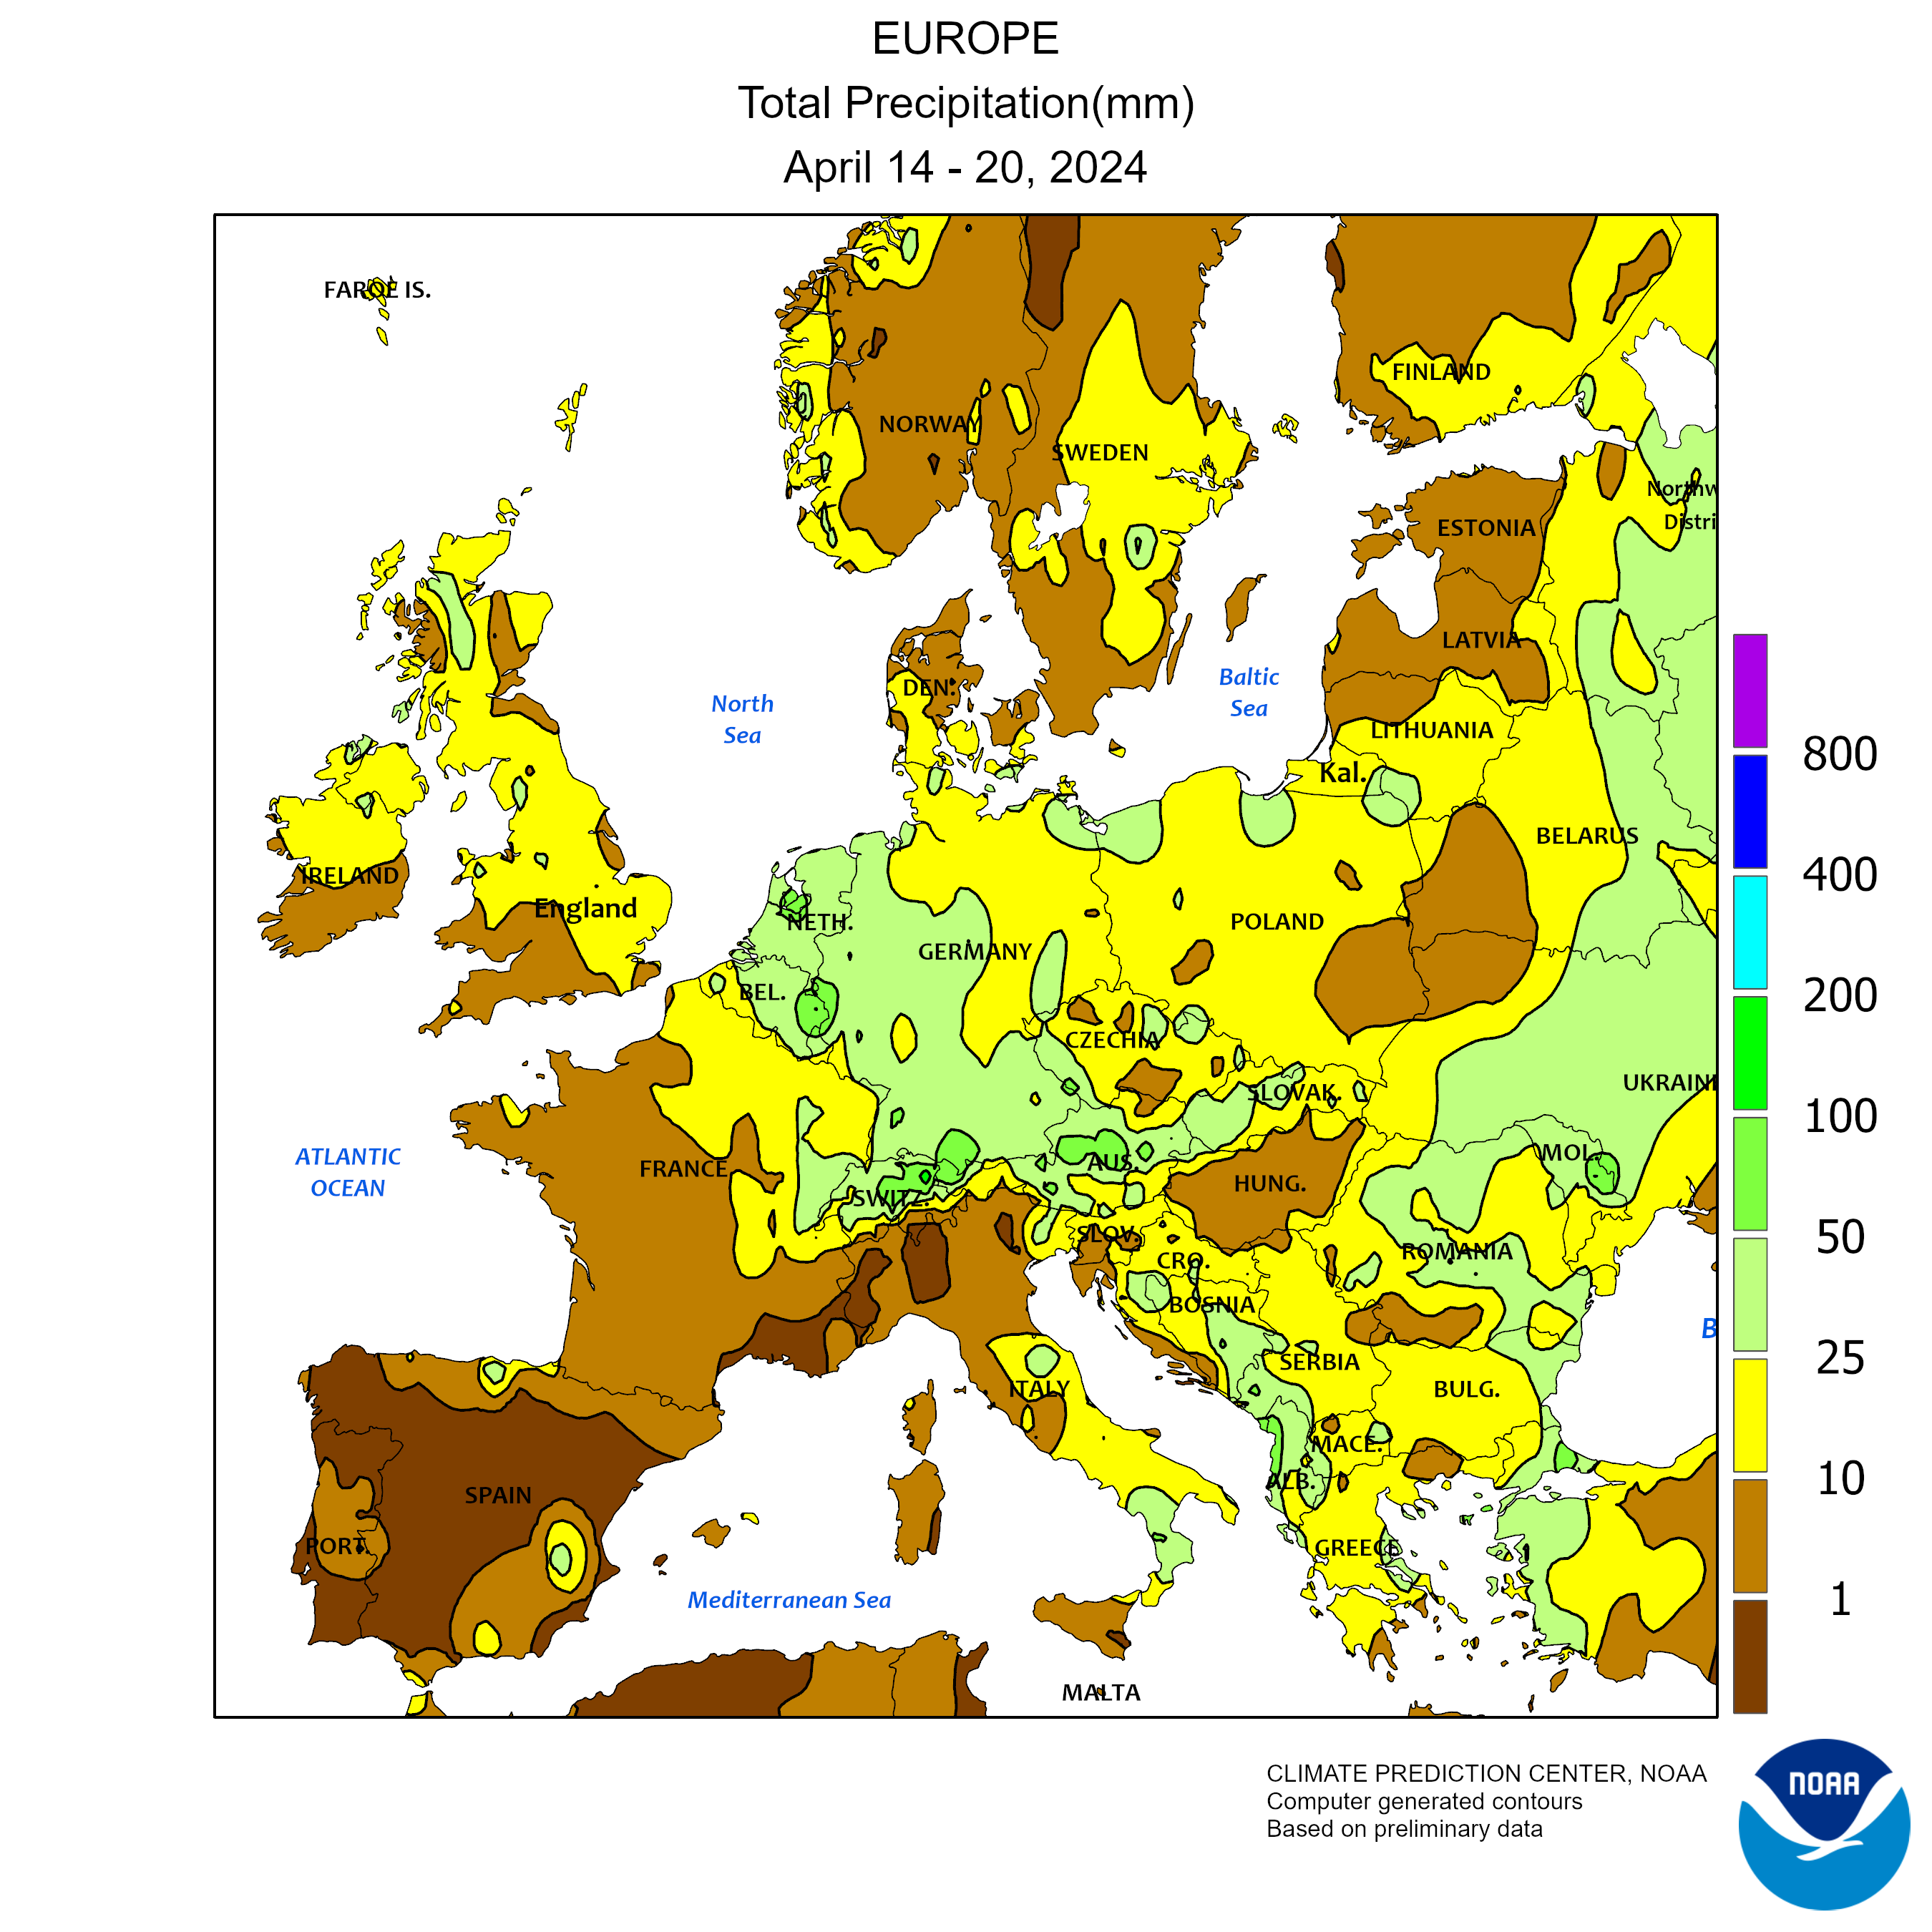
Total Precipitation
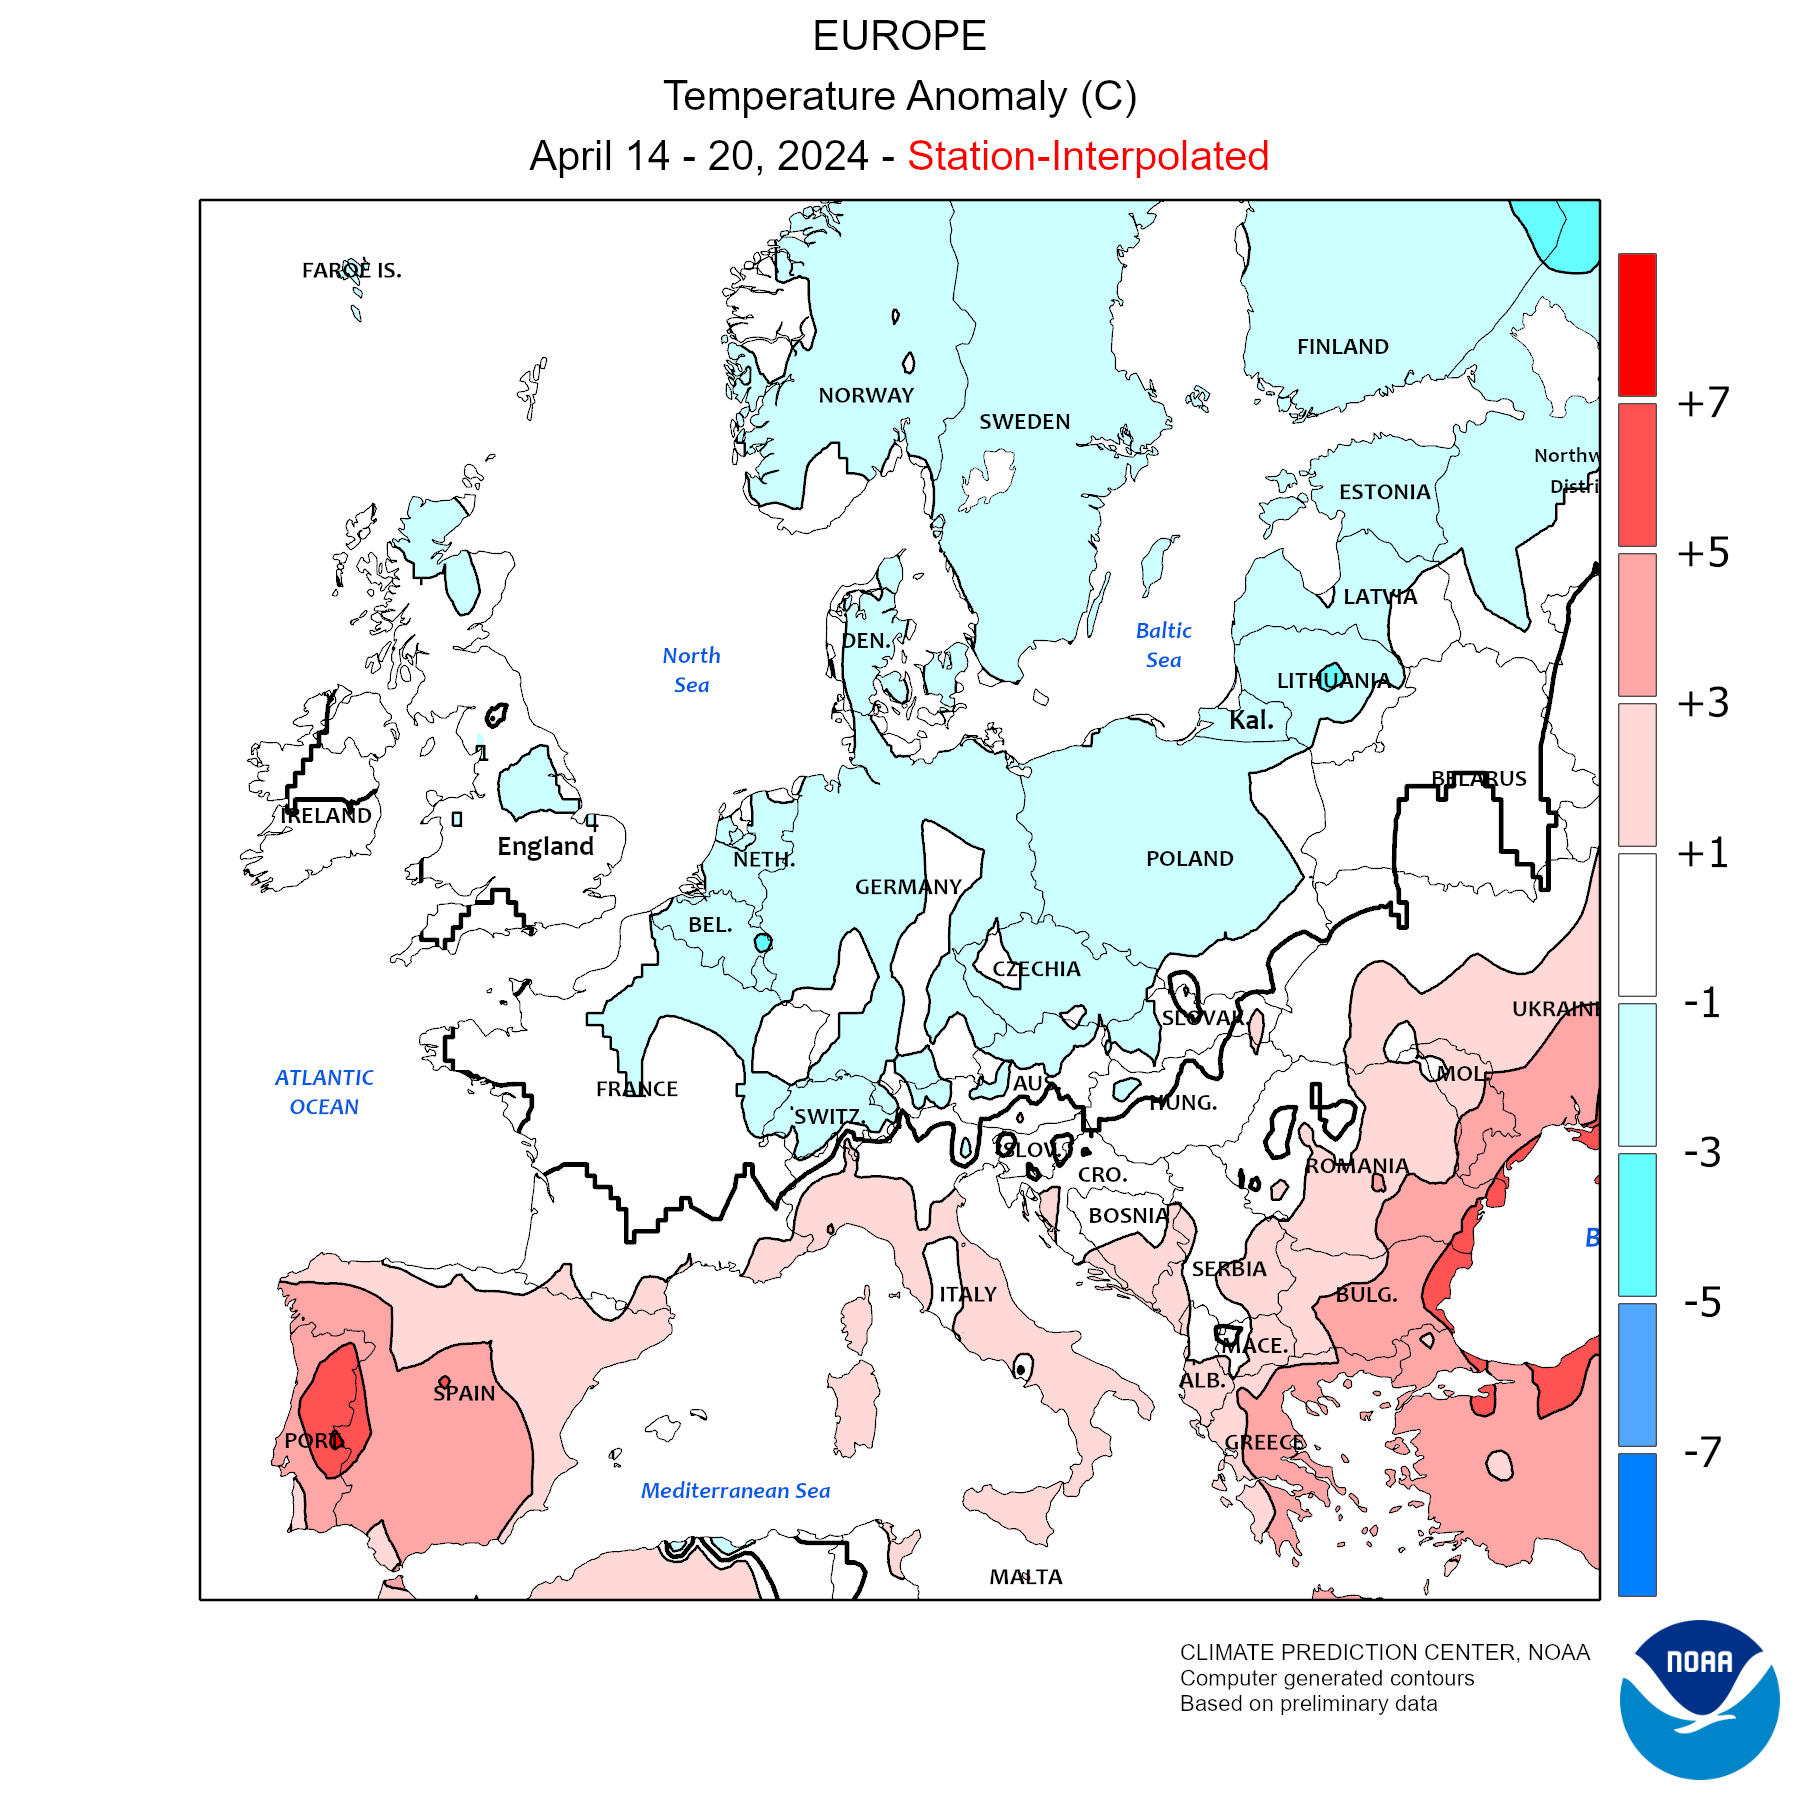
Temperature anomalies
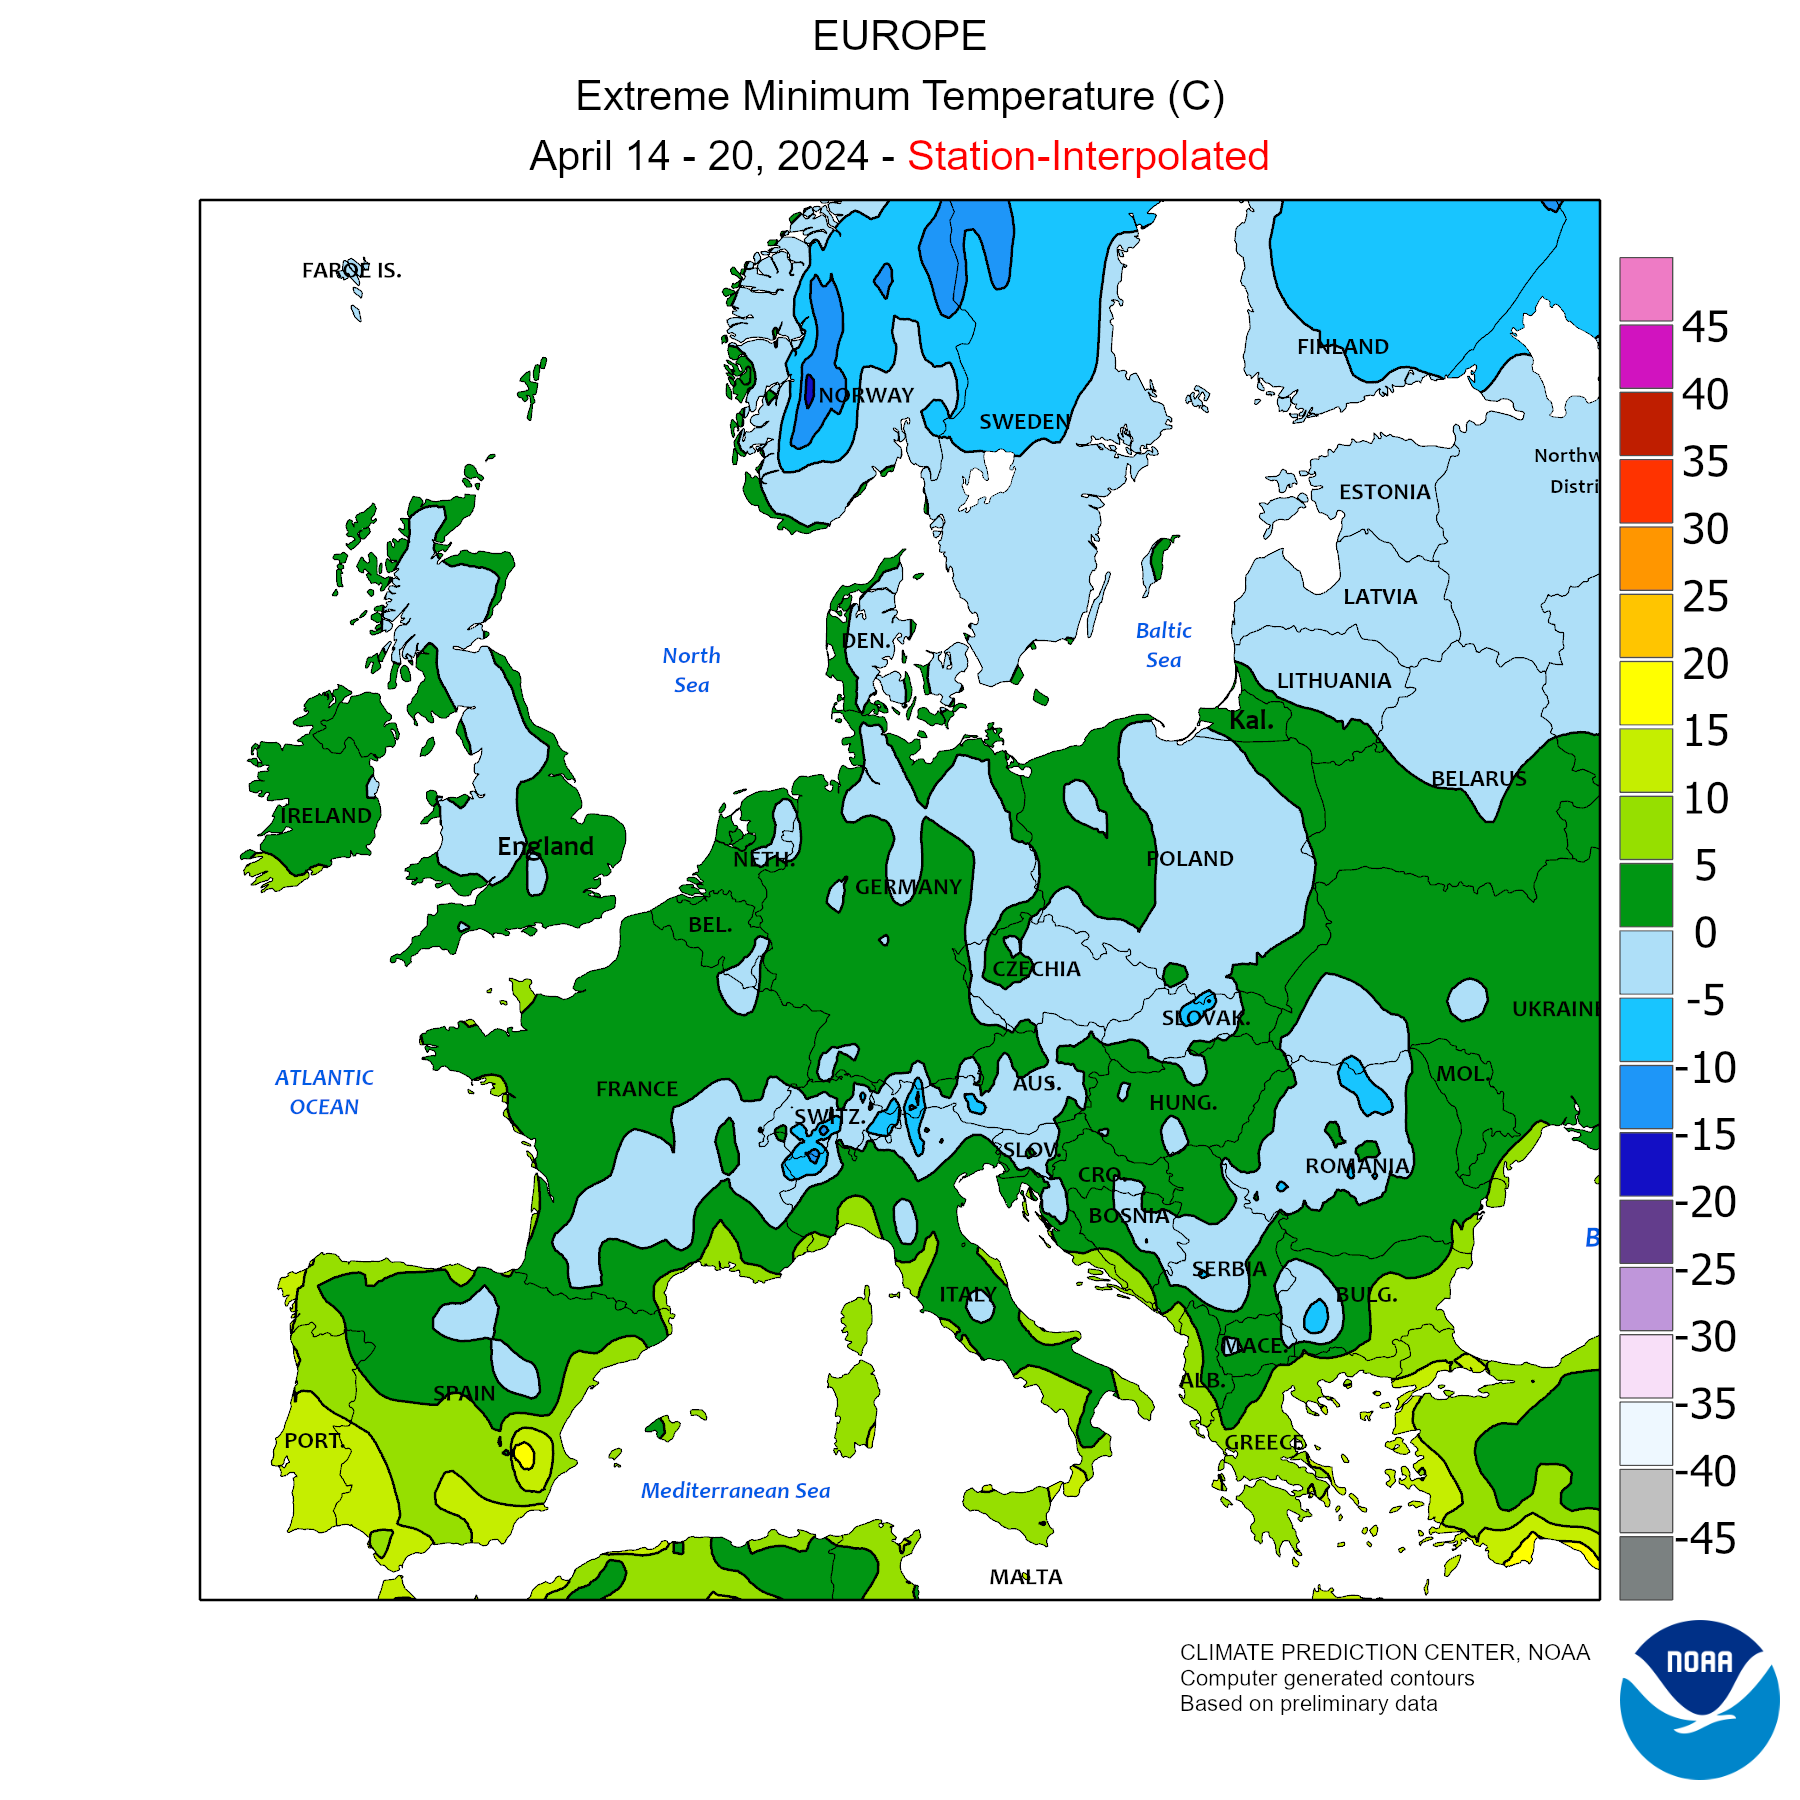
Min Temperature
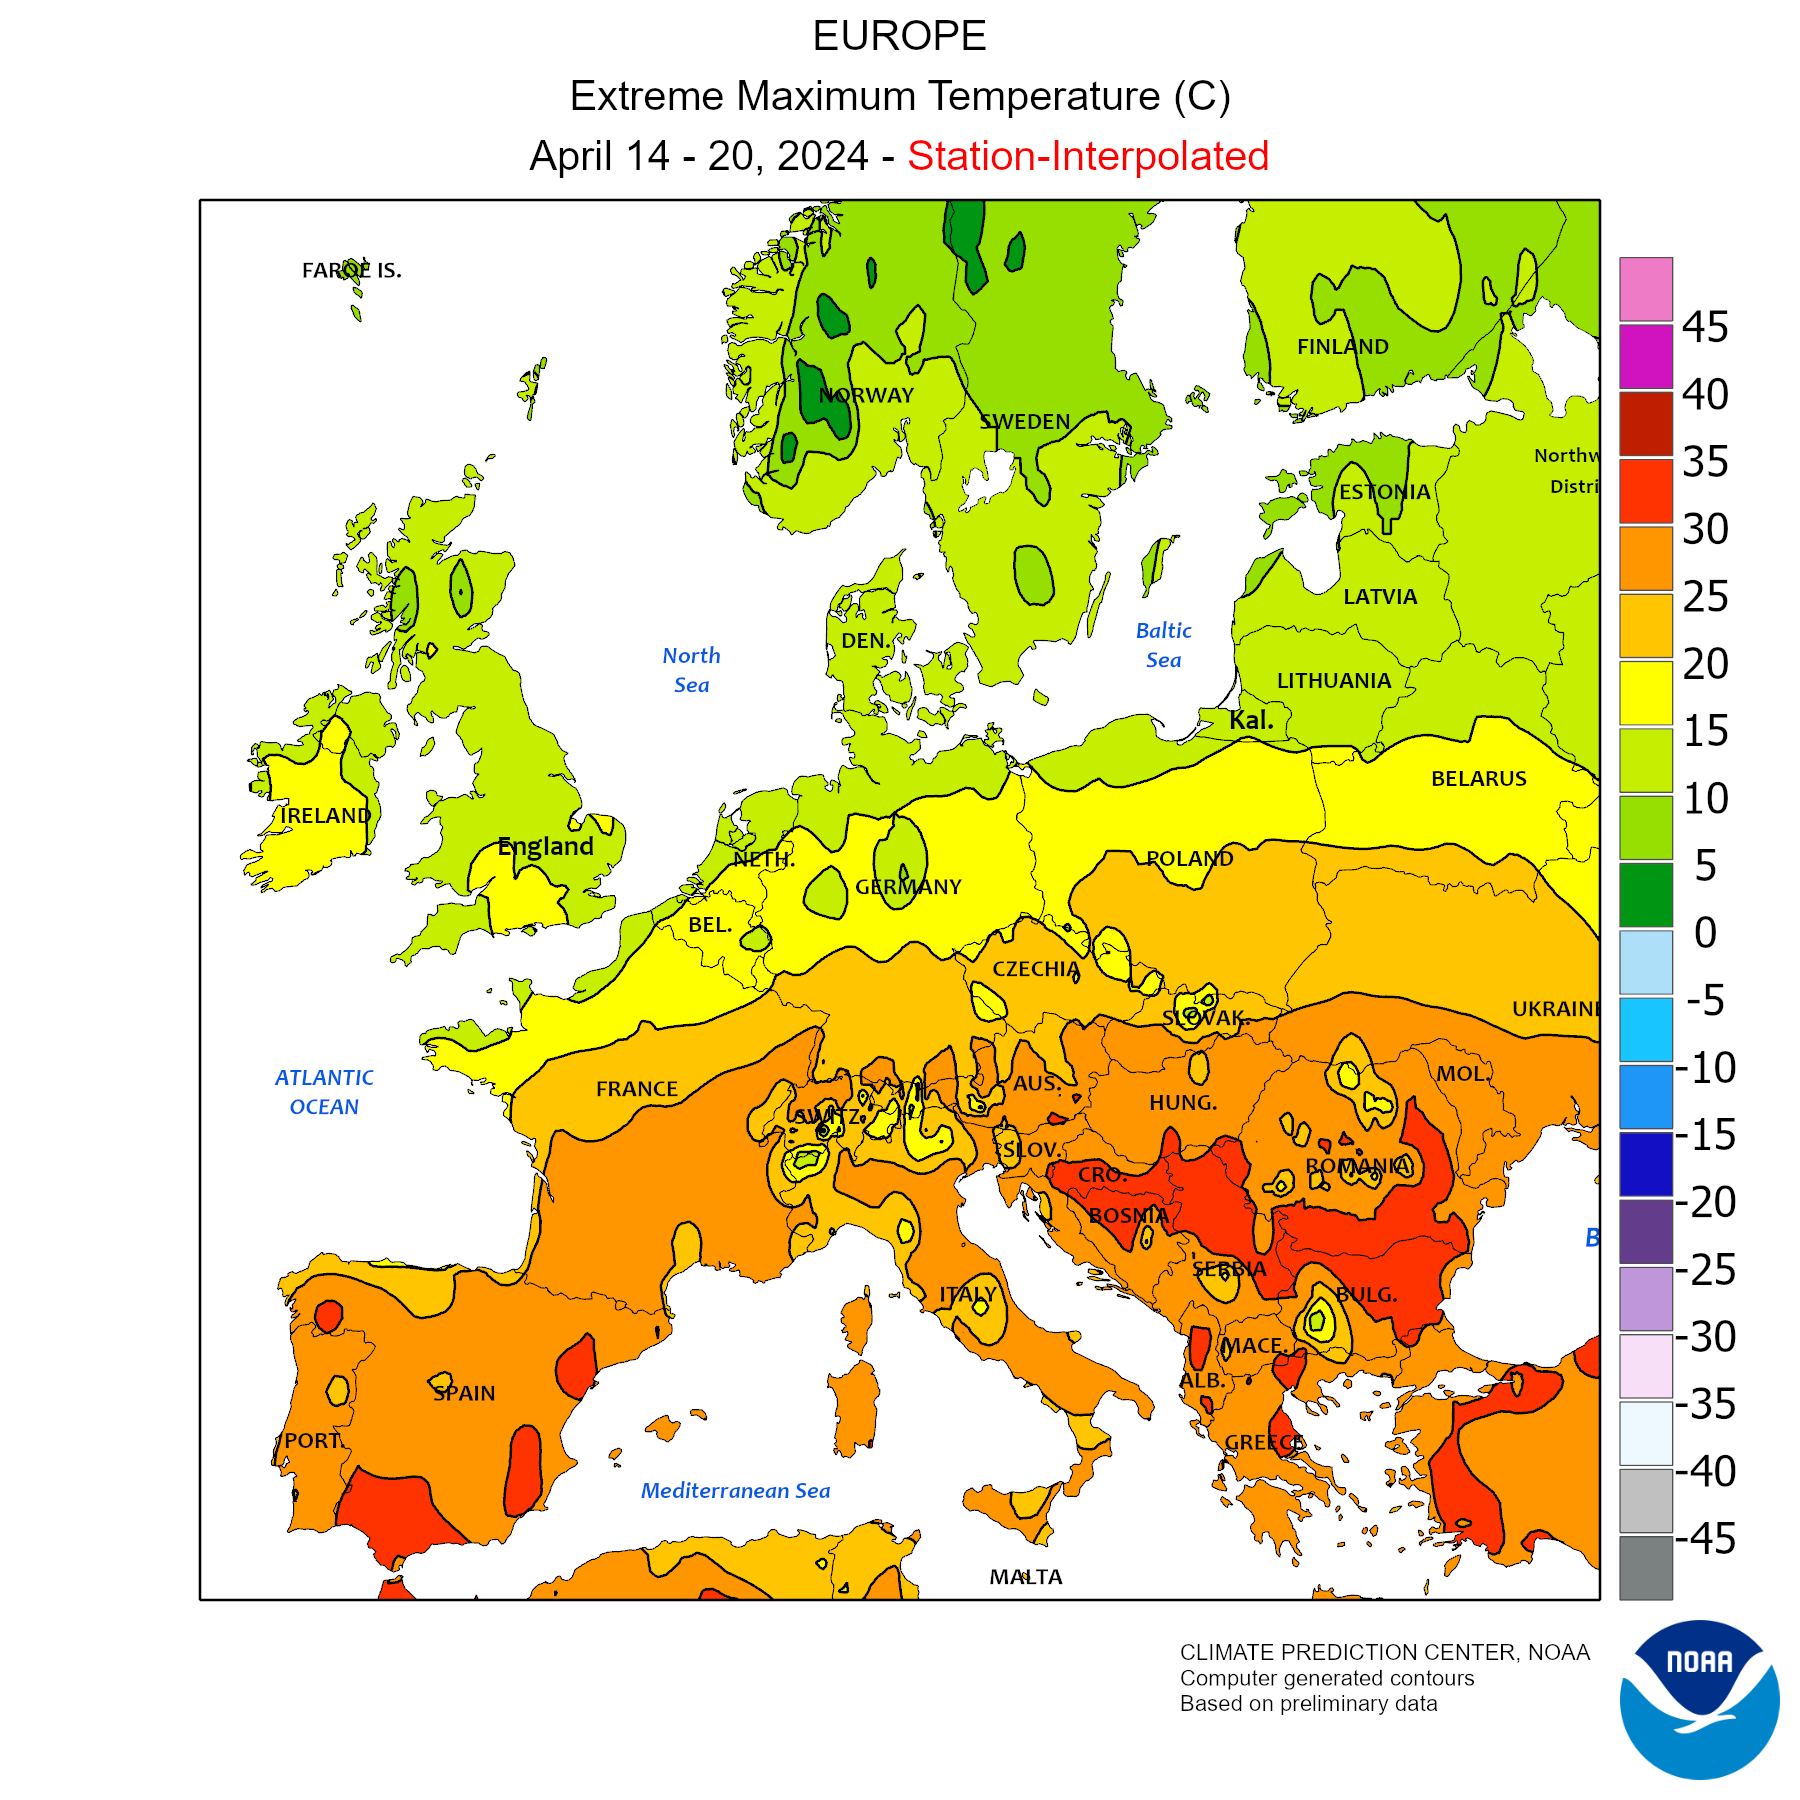
Max Temperature
×
×
×
×
| CROATIA: DAIRY SECTOR | |||||||||
| x 1.000 ton | |||||||||
| RAW MATERIAL AREA | 2020 | 2021 | 2022 | 2023 | 2023 | 2024 | % | Period | |
| Cow's Milk | |||||||||
| Dairy Farm Structure | |||||||||
| Live bovine animals ('000 Head) | 423 | 428 | 422 | 415 | |||||
| of which | |||||||||
| Cows ('000 Head) | 110 | 102 | 79 | 71 | |||||
| Slaughtered cows ('000 head) | 16 | 17 | 18 | 16 | 1,6 | 1,4 | -12,5% | Jan 2024 | |
| Export of Breeding Heifers (HS 01022110 - head) | 4.258 | 9.148 | 5.819 | 7.524 | 10 | 302 | >1000% | Jan 2024 | |
| Import of Breeding Heifers (HS 01022110 - head) | 1.056 | 465 | 700 | 707 | |||||
| Milk production | 596 | 557 | 522 | ||||||
| ± % Over the same period of the previous year | -6,5% | -6,3% | |||||||
| Raw cows' milk delivered to dairies (Cod. Eurostat D1110D) | 434 | 429 | 405 | 377 | 65 | 63 | -2,1% | Jan-Feb 2024 | |
| ± % Over the same period of the previous year | -1,2% | -5,5% | -7,0% | ||||||
| % Delivery on production *** | 72,8% | 77,0% | 77,7% | ||||||
| % Protein | 3,45% | 3,47% | 3,48% | 3,50% | 3,54% | 3,58% | Jan-Feb 2024 | ||
| % Fat | 4,00% | 4,00% | 4,04% | 4,07% | 4,18% | 4,18% | Jan-Feb 2024 | ||
| Farm-gate milk price (€ per 100 Kg) | 33,33 | 33,80 | 42,71 | 49,84 | 51,42 | 48,55(e) | -5,6% | Jan-Mar 2024 | |
| ± % Over the same period of the previous year | +1,4% | +26,4% | +16,7% | ||||||
| Organic milk production (goat, sheep, cow) | 1,9 | 0,9 | 0,1 | - | |||||
| Goat's - Sheep's Milk | |||||||||
| Goats ('000) | 86 | 86 | 82 | 73 | |||||
| Goat's Milk Production (Cod.Eurostat D1130A) | 9,0 | 7,0 | 7,0 | - | |||||
| Goat's Milk Delivered to dairies (Cod.Eurostat D1130D) | 4,1 | 3,9 | 3,6 | - | |||||
| Sheeps ('000) | 662 | 654 | 643 | 552 | |||||
| Sheep's Milk Production (Cod.Eurostat D1120A) | 7,0 | 5,0 | 6,0 | - | |||||
| Sheep's Milk Delivered to dairies (Cod.Eurostat D1120D) | 2,8 | 2,8 | 2,2 | - | |||||
| DAIRY PRODUCTION | 2020 | 2021 | 2022 | 2023 | 2023 | 2024 | % | Period | |
| Drinking milk (Cod. Eurostat D2100) | 231 | 215 | 232 | 208 | 37 | 37 | +1,1% | Jan-Feb 2024 | |
| Cream for direct consumption (Cod. Eurostat D2200V) | 32 | 30 | 32 | 32 | 4,8 | 5,2 | +7,9% | Jan-Feb 2024 | |
| Acidified milk (yoghurts and other) (Cod. Eurostat D4100) | 89 | 89 | 87 | 89 | 13 | 14 | +8,7% | Jan-Feb 2024 | |
| Butter (Cod. Eurostat D6000) | 5,0 | 4,5 | 4,8 | 3,7 | 0,9 | 0,6 | -30,2% | Jan-Feb 2024 | |
| Total Cheese (Cod. Eurostat D7100) | 32 | 33 | 34 | - | |||||
| I° Classificazione | |||||||||
| - Soft cheese ( Cod. Eurostat D7111) | 2,1 | 1,5 | 0,5 | - | |||||
| - Medium soft cheese ( Cod. Eurostat D7112) | 0,1 | 0,2 | 0,2 | - | |||||
| - Medium hard cheese ( Cod. Eurostat D7113) | 12 | 13 | 13 | - | |||||
| - Hard cheese ( Cod. Eurostat D7114) | 0,9 | 1,0 | 0,8 | - | |||||
| - Extra hard cheese ( Cod. Eurostat D7115) | 0,4 | 0,4 | 2,3 | - | |||||
| - Fresh cheese ( Cod. Eurostat D7116) | 17 | 17 | 17 | - | |||||
| 2° Classificazione | |||||||||
| - Cheese from cows'milk (pure) ( Cod. Eurostat D7121) | 31 | 32 | 33 | - | |||||
| Cheese from cows' milk (Cod. Eurostat D7121) | 31 | 32 | 33 | 33 | 5,0 | 5,2 | +3,2% | Jan-Feb 2024 | |
| Processed Cheese (Cod. Eurostat D7200) | 2,9 | 2,9 | 2,8 | - | |||||
| Drinks with a milk base (Cod. Eurostat D9100) | 23 | 23 | 20 | - | |||||
| Whey(Cod. Eurostat D5000) | 80 | 64 | 60 | - | |||||
| of which | |||||||||
| EXPORT | 2020 | 2021 | 2022 | 2023 | Jan | of which Extra EU | 2023 2024 % | 2023 2024 % | |
| Yogurt and buttermilk (0403) | TOP importers | 18 | 20 | 22 | 23 | 1,7 2,0 +17,3% | 0,8 0,8 -1,6% | ||
| Latte Confezionato (04011010+04012011+04012091) | TOP importers | 20 | 19 | 22 | 14 | 1,5 1,0 -32,9% | 1,5 0,8 -44,8% | ||
| Whole (04012091) | TOP importers | 2,8 | 1,3 | 1,7 | 2,2 | 0,1 0,2 +134,0% | - - - | ||
| Semi-Skimmed (04012011) | TOP importers | 15 | 15 | 16 | 10 | 1,1 0,6 -47,9% | 1,1 0,6 -50,6% | ||
| Skimmed (04011010) | TOP importers | 2,8 | 2,6 | 3,9 | 2,1 | 0,3 0,2 -23,3% | 0,3 0,2 -23,3% | ||
| Fat-Filled Milk Powder (FFMP) (190190) | TOP importers | 22 | 19 | 16 | 13 | 1,1 1,0 -5,9% | 0,4 0,3 -18,1% | ||
| Cheese (0406) | TOP importers | 8,4 | 8,7 | 8,9 | 8,8 | 0,7 0,6 -1,1% | 0,3 0,2 -16,0% | ||
| Infant milk formula (190110) | TOP importers | 8,3 | 7,6 | 6,2 | 5,7 | 0,5 0,5 +1,7% | 0,1 0,1 +1,7% | ||
| Cream (040130+040140+040150) | TOP importers | 1,0 | 1,3 | 4,1 | 5,0 | 0,3 0,4 +33,6% | 0,1 0,2 +26,0% | ||
| Whey (0404) | TOP importers | 3,7 | 3,1 | 3,1 | 4,8 | 0,4 0,8 +104,4% | 0,3 0,8 +131,0% | ||
| Sweet dairy Whey (12% protein) and WPC (040410) | TOP importers | 2,6 | 2,7 | 2,5 | 3,1 | 0,2 0,2 -5,9% | 0,2 0,2 -9,9% | ||
| Other Product | 9,9 | 5,0 | 2,7 | 3,1 | 0,2 0,7 +253,8% | 0,1 0,6 +670,8% | |||
| IMPORT | 2020 | 2021 | 2022 | 2023 | Jan | of which Extra EU | 2023 2024 % | 2023 2024 % | |
| Latte Sfuso (04011090+04012019+04012099) | TOP exporters | 170 | 177 | 191 | 192 | 18 14 -21,4% | - - - | ||
| Whole (04012099) | TOP exporters | 154 | 164 | 179 | 182 | 18 14 -21,4% | - - - | ||
| Semi-skimmed (04012019) | TOP exporters | 0,3 | 0,3 | 1,4 | 0,7 | 0,1 0,0 -22,3% | - - - | ||
| Skimmed (04011090) | TOP exporters | 16 | 13 | 11 | 9,1 | 0,5 0,4 -20,0% | - - - | ||
| Cheese (0406) | TOP exporters | 32 | 36 | 38 | 42 | 2,9 3,2 +12,8% | 0,1 0,1 -8,0% | ||
| Latte Confezionato (04011010+04012011+04012091) | TOP exporters | 29 | 28 | 32 | 38 | 2,5 4,9 +97,6% | - - - | ||
| Whole (04012091) | TOP exporters | 10 | 12 | 12 | 8,1 | 0,7 0,8 +20,4% | - - - | ||
| Semi-Skimmed (04012011) | TOP exporters | 19 | 16 | 19 | 29 | 1,7 4,0 +130,3% | - - - | ||
| Skimmed (04011010) | TOP exporters | 0,2 | 0,4 | 0,3 | 0,4 | 0,0 0,0 -7,4% | - - - | ||
| Yogurt and buttermilk (0403) | TOP exporters | 9,9 | 14 | 13 | 12 | 0,7 1,1 +59,2% | 0,2 0,4 +101,3% | ||
| Cream (040130+040140+040150) | TOP exporters | 6,2 | 6,1 | 8,7 | 11 | 0,5 0,9 +81,9% | - - - | ||
| Fat-Filled Milk Powder (FFMP) (190190) | TOP exporters | 8,8 | 11 | 10 | 11 | 0,7 0,9 +23,0% | - - - | ||
| Butter And Other Fats (0405) | TOP exporters | 3,5 | 3,7 | 3,9 | 5,0 | 0,4 0,4 +5,0% | - - - | ||
| Anhydrous Milk Fat (040590) | TOP exporters | 0,4 | 0,5 | 0,4 | 0,4 | 0,0 0,0 +229,1% | - - - | ||
| SMP (040210) | TOP exporters | 3,0 | 3,6 | 3,8 | 4,0 | 0,2 0,3 +40,2% | - - - | ||
| Other Product | 12 | 13 | 13 | 13 | 0,9 1,6 +75,3% | - - - | |||
| Soya-based beverages (protein content >=2,8 %) | 1,5 | 2,1 | 1,9 | 1,7 | 0,1 0,2 +35,9% | - - - | |||
| Soya-based beverages (protein content of <2.8%) based on nuts, cereals or seeds | 2,5 | 3,5 | 4,9 | 5,4 | 0,3 0,4 +14,6% | - - - | |||
| Non-alcoholic beverages containing < 0,2% fats derived from milk or milk products | 0,5 | 0,5 | 0,9 | 1,0 | 0,1 0,1 +38,8% | - - - | |||
| % Self-sufficiency rate | 51,42% | 47,73% | 44,88% | 40,76% | 43,17% | Jan 2024 | |||
| SOCIO-ECONOMIC INDICATORS | 2020 | 2021 | 2022 | 2023 | 2023 | 2024(f) | % | Period | |
| Population ('000) | 4.058 | 4.036 | 3.862 | 3.851 | |||||
| GDP per capita (U.S. dollars) | 14.231 | 17.771 | 18.305 (e) | 20.877 (e) | |||||
| GDP per capita (€) * | 12.451 | 15.025 | 17.383(e) | 19.307(e) | |||||
Informative Note
(c): confidential data, missing months
(f): forecast
(e) estimated
* Per capita GDP in Euro is calculated by using the yearly average exchange rate
SOURCES
Raw material area: Sheep and Goat Milk Deliveries: Eurostat (annual data dataset: apro_mk_pobta); Milk Deliveries, % Protein e % Fat: Eurostat (dataset: apro_mk_colm); Milk Production: Eurostat (dataset: agr_r_milkpr); Number of cows: Eurostat (dataset: agr_r_animal); Number of Goats, Sheeps and Bufaloes: Eurostat (dataset: apro_mt_lsgoat, apro_mt_lssheep, apro_mt_lscatl ); Sheep and Goat Milk Production: Eurostat (annual data dataset: apro_mk_farm); Farm-gate milk price: Milk Market Observatory; Import/Export of Breeding Heifers: IHS ; Organic Milk Production: Eurostat (dataset: org_aprod);
Dairy production: (annual data dataset: apro_mk_pobta, monthly data dataset: apro_mk_colm)
Export: Eurostat
Import: Eurostat
GDP per capita: International Monetary Found
Population: Eurostat
*** MILK DELIVERIES AND MILK PRODUCTION
Note: Self-sufficiency rate = Milk deliveries/(Domestic use in milk equivalent ME)
Domestic use in milk equivalent (ME) = Milk deliveries + Import in ME - Export in ME
The Self-sufficiency rate does not consider the trade of FFMP (fat-filled milk powder) - HS 190190 and the infant milk formula.
Last update: 24-04-2024
(f): forecast
(e) estimated
* Per capita GDP in Euro is calculated by using the yearly average exchange rate
SOURCES
Raw material area: Sheep and Goat Milk Deliveries: Eurostat (annual data dataset: apro_mk_pobta); Milk Deliveries, % Protein e % Fat: Eurostat (dataset: apro_mk_colm); Milk Production: Eurostat (dataset: agr_r_milkpr); Number of cows: Eurostat (dataset: agr_r_animal); Number of Goats, Sheeps and Bufaloes: Eurostat (dataset: apro_mt_lsgoat, apro_mt_lssheep, apro_mt_lscatl ); Sheep and Goat Milk Production: Eurostat (annual data dataset: apro_mk_farm); Farm-gate milk price: Milk Market Observatory; Import/Export of Breeding Heifers: IHS ; Organic Milk Production: Eurostat (dataset: org_aprod);
Dairy production: (annual data dataset: apro_mk_pobta, monthly data dataset: apro_mk_colm)
Export: Eurostat
Import: Eurostat
GDP per capita: International Monetary Found
Population: Eurostat
*** MILK DELIVERIES AND MILK PRODUCTION
- Milk deliveries (apro_mk_colm): milk collected by dairies (located in the Member State) from the agricultural holdings (within or outside the Member State).
- Milk production (agr_r_milkpr): milk produced by agricultural holdings (located in the Member State) and a part of this milk is delivered to dairies (within or outside the Member State).
Note: Self-sufficiency rate = Milk deliveries/(Domestic use in milk equivalent ME)
Domestic use in milk equivalent (ME) = Milk deliveries + Import in ME - Export in ME
The Self-sufficiency rate does not consider the trade of FFMP (fat-filled milk powder) - HS 190190 and the infant milk formula.
Last update: 24-04-2024
NOTA: Access to Dairy World Trade,
which also contains the processing of Import / Export of the Croatia with MONTHLY UPDATES,
is reserved for Supporters of CLAL.it