


.jpg)


.jpg)


France: Dairy sector
This Country:
- accounts for 16,2% of EU milk deliveries (year 2023),
- exports dairy products, converted into milk equivalent (ME), for the 40,1% of the milk deliveries (year 2023),
- accounts for 11,6% of EU dairy exports in ME (year 2023).
The orange links allow a further analysis on TESEO.
![]()
![]()
![]()
![]()
Latest climate weekly reports about precipitations and temperatures.
Total Precipitation: level of rainfall;
Temperature anomalies: variation compared to historical mean temperature;
Min Temperature: minimum temperature;
Max Temperature: maximum temperature;
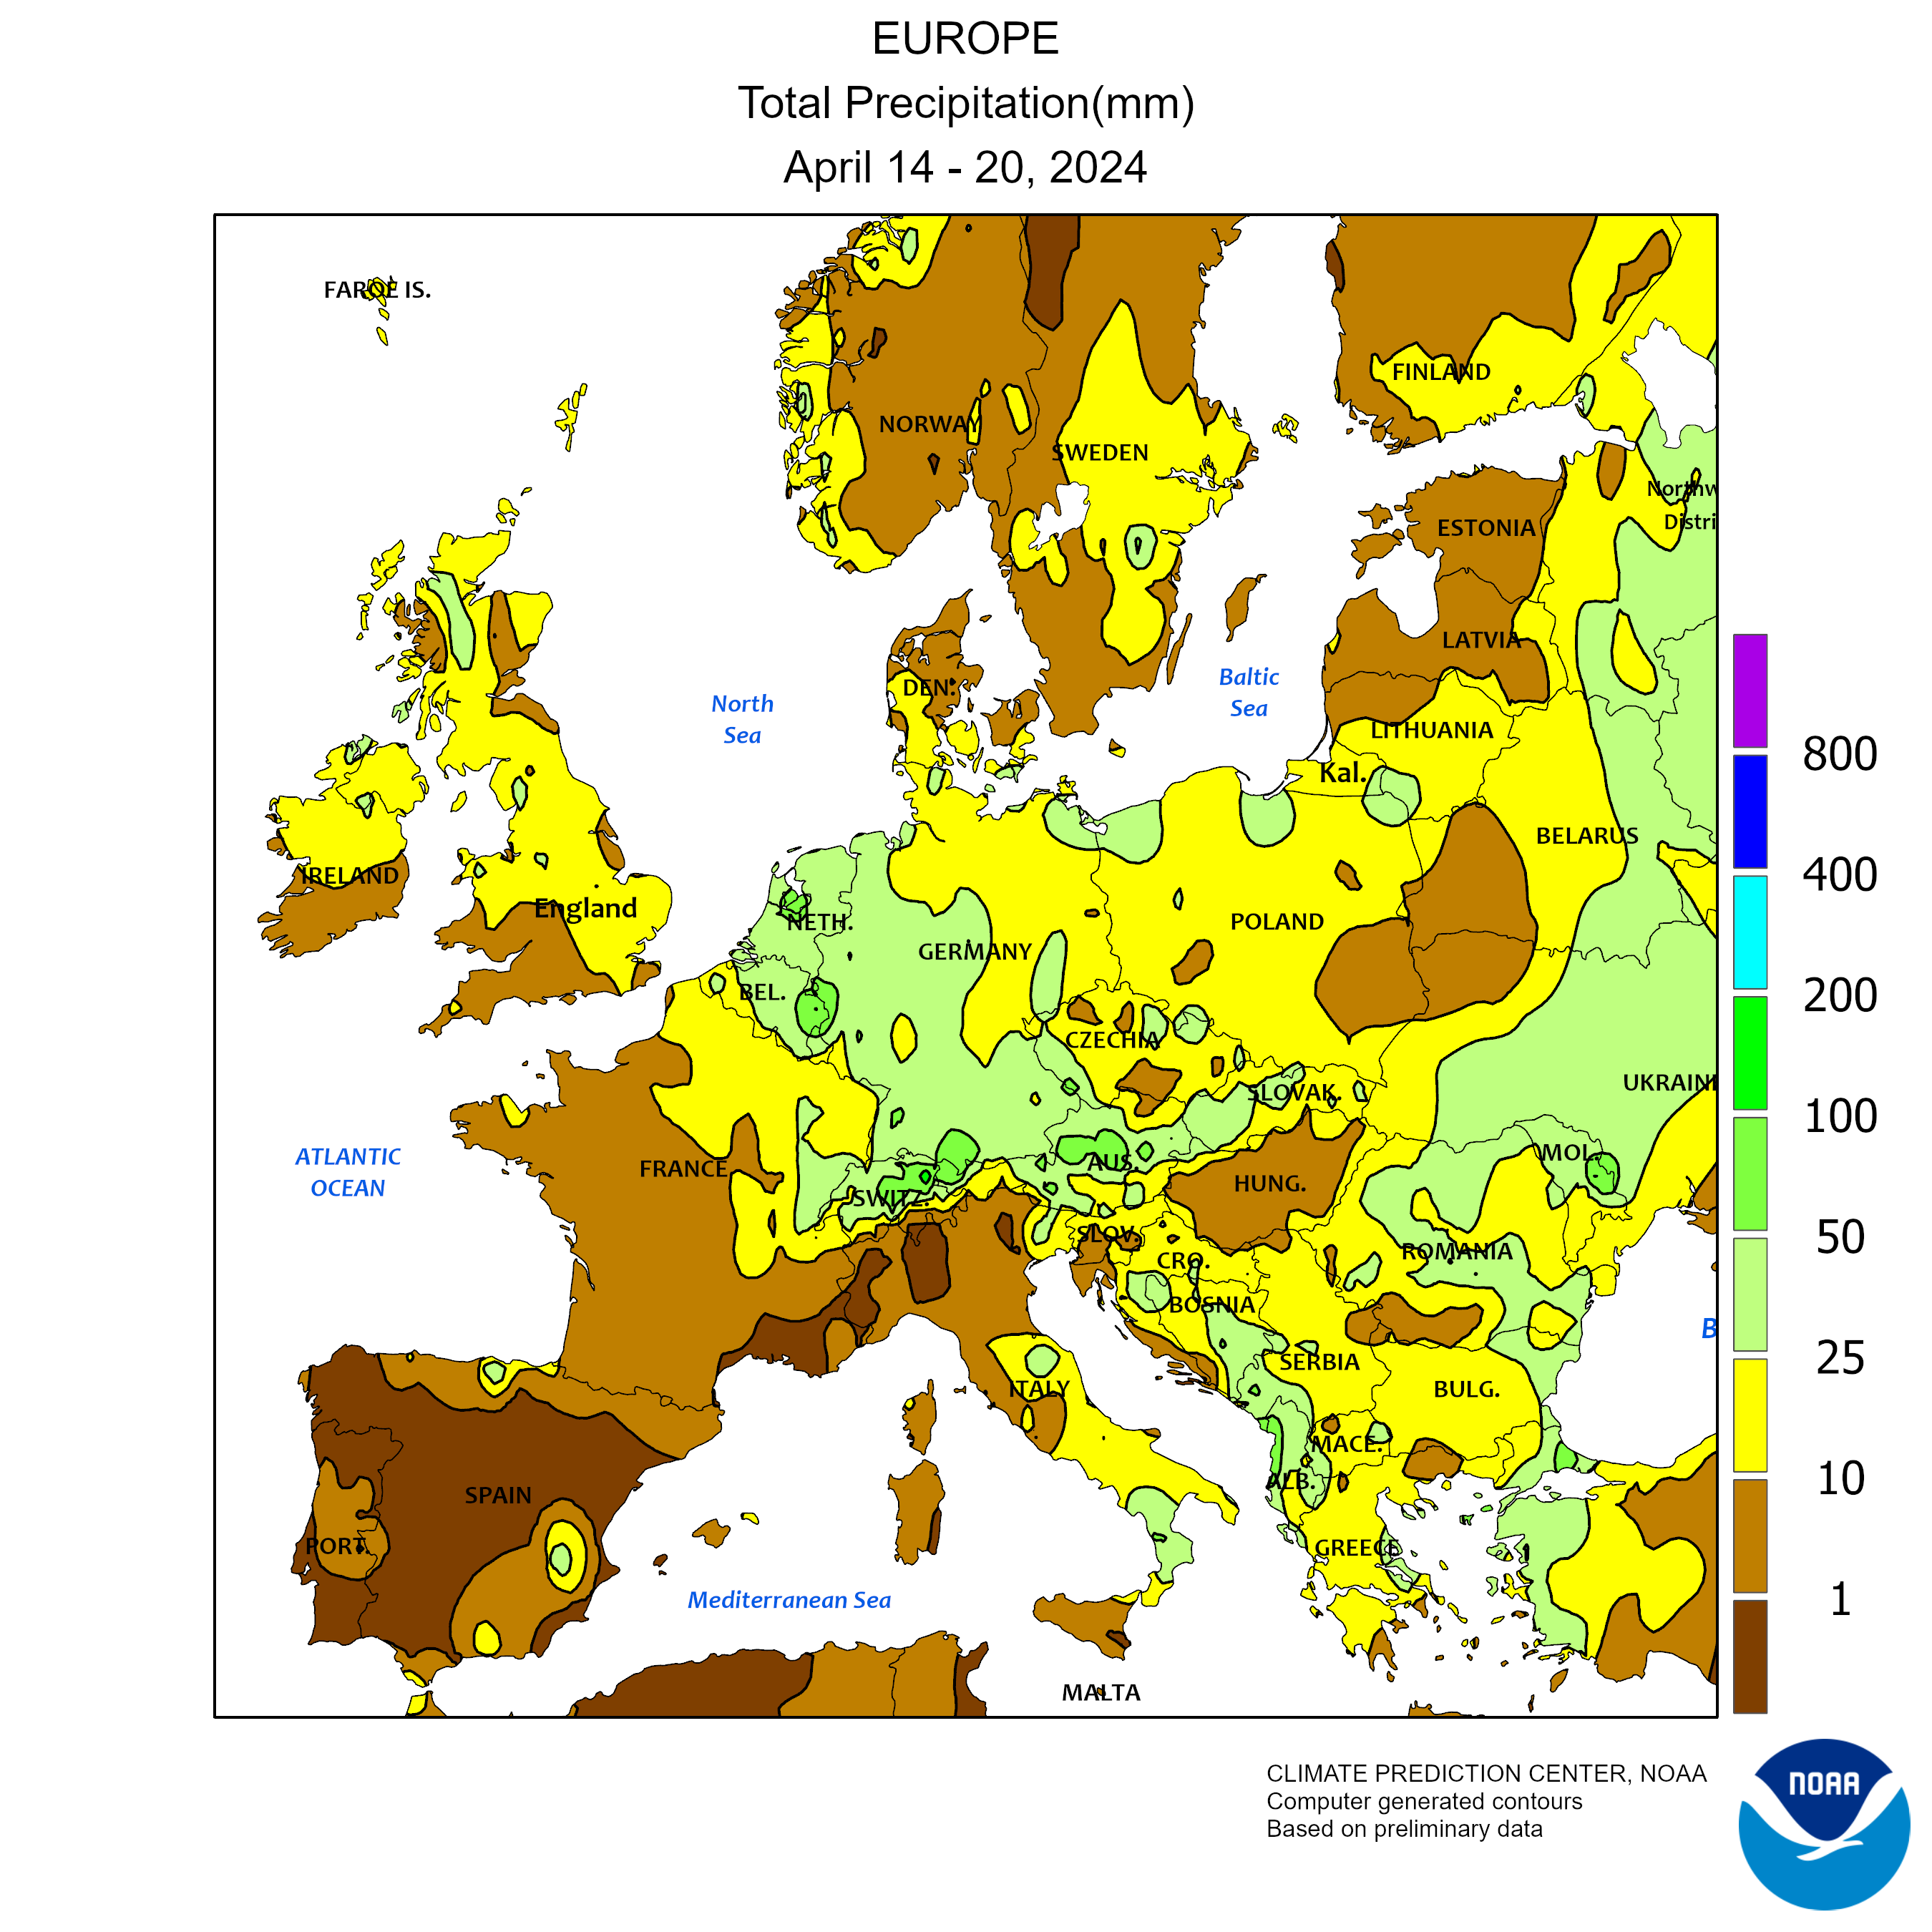
Total Precipitation
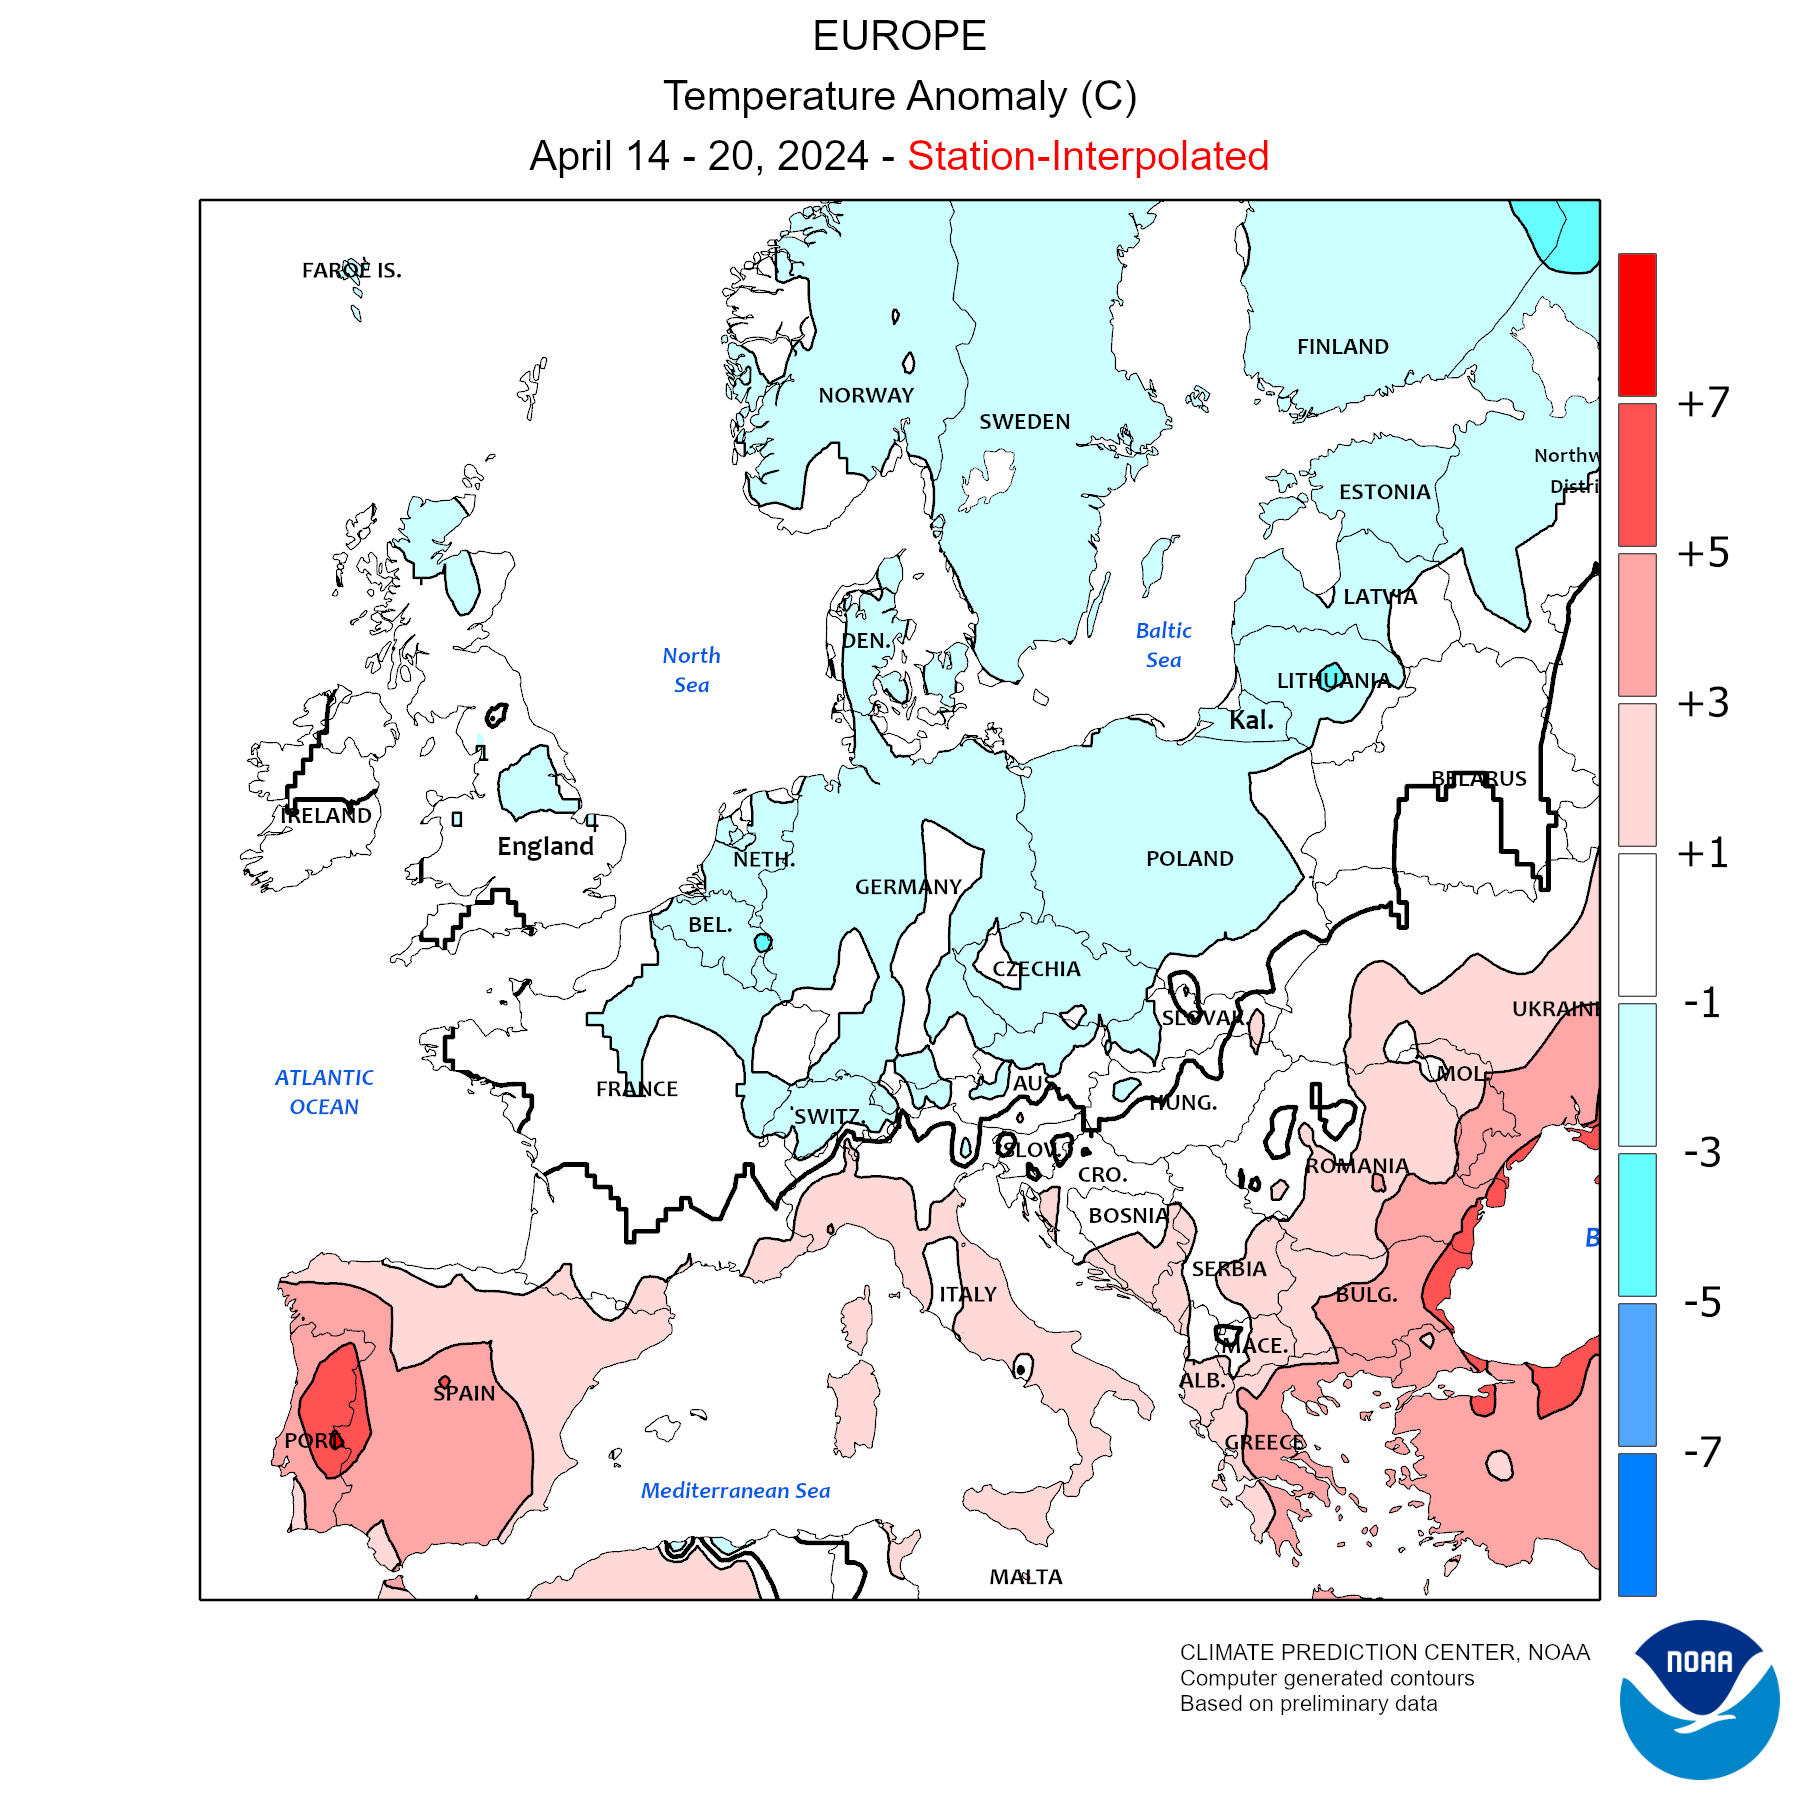
Temperature anomalies
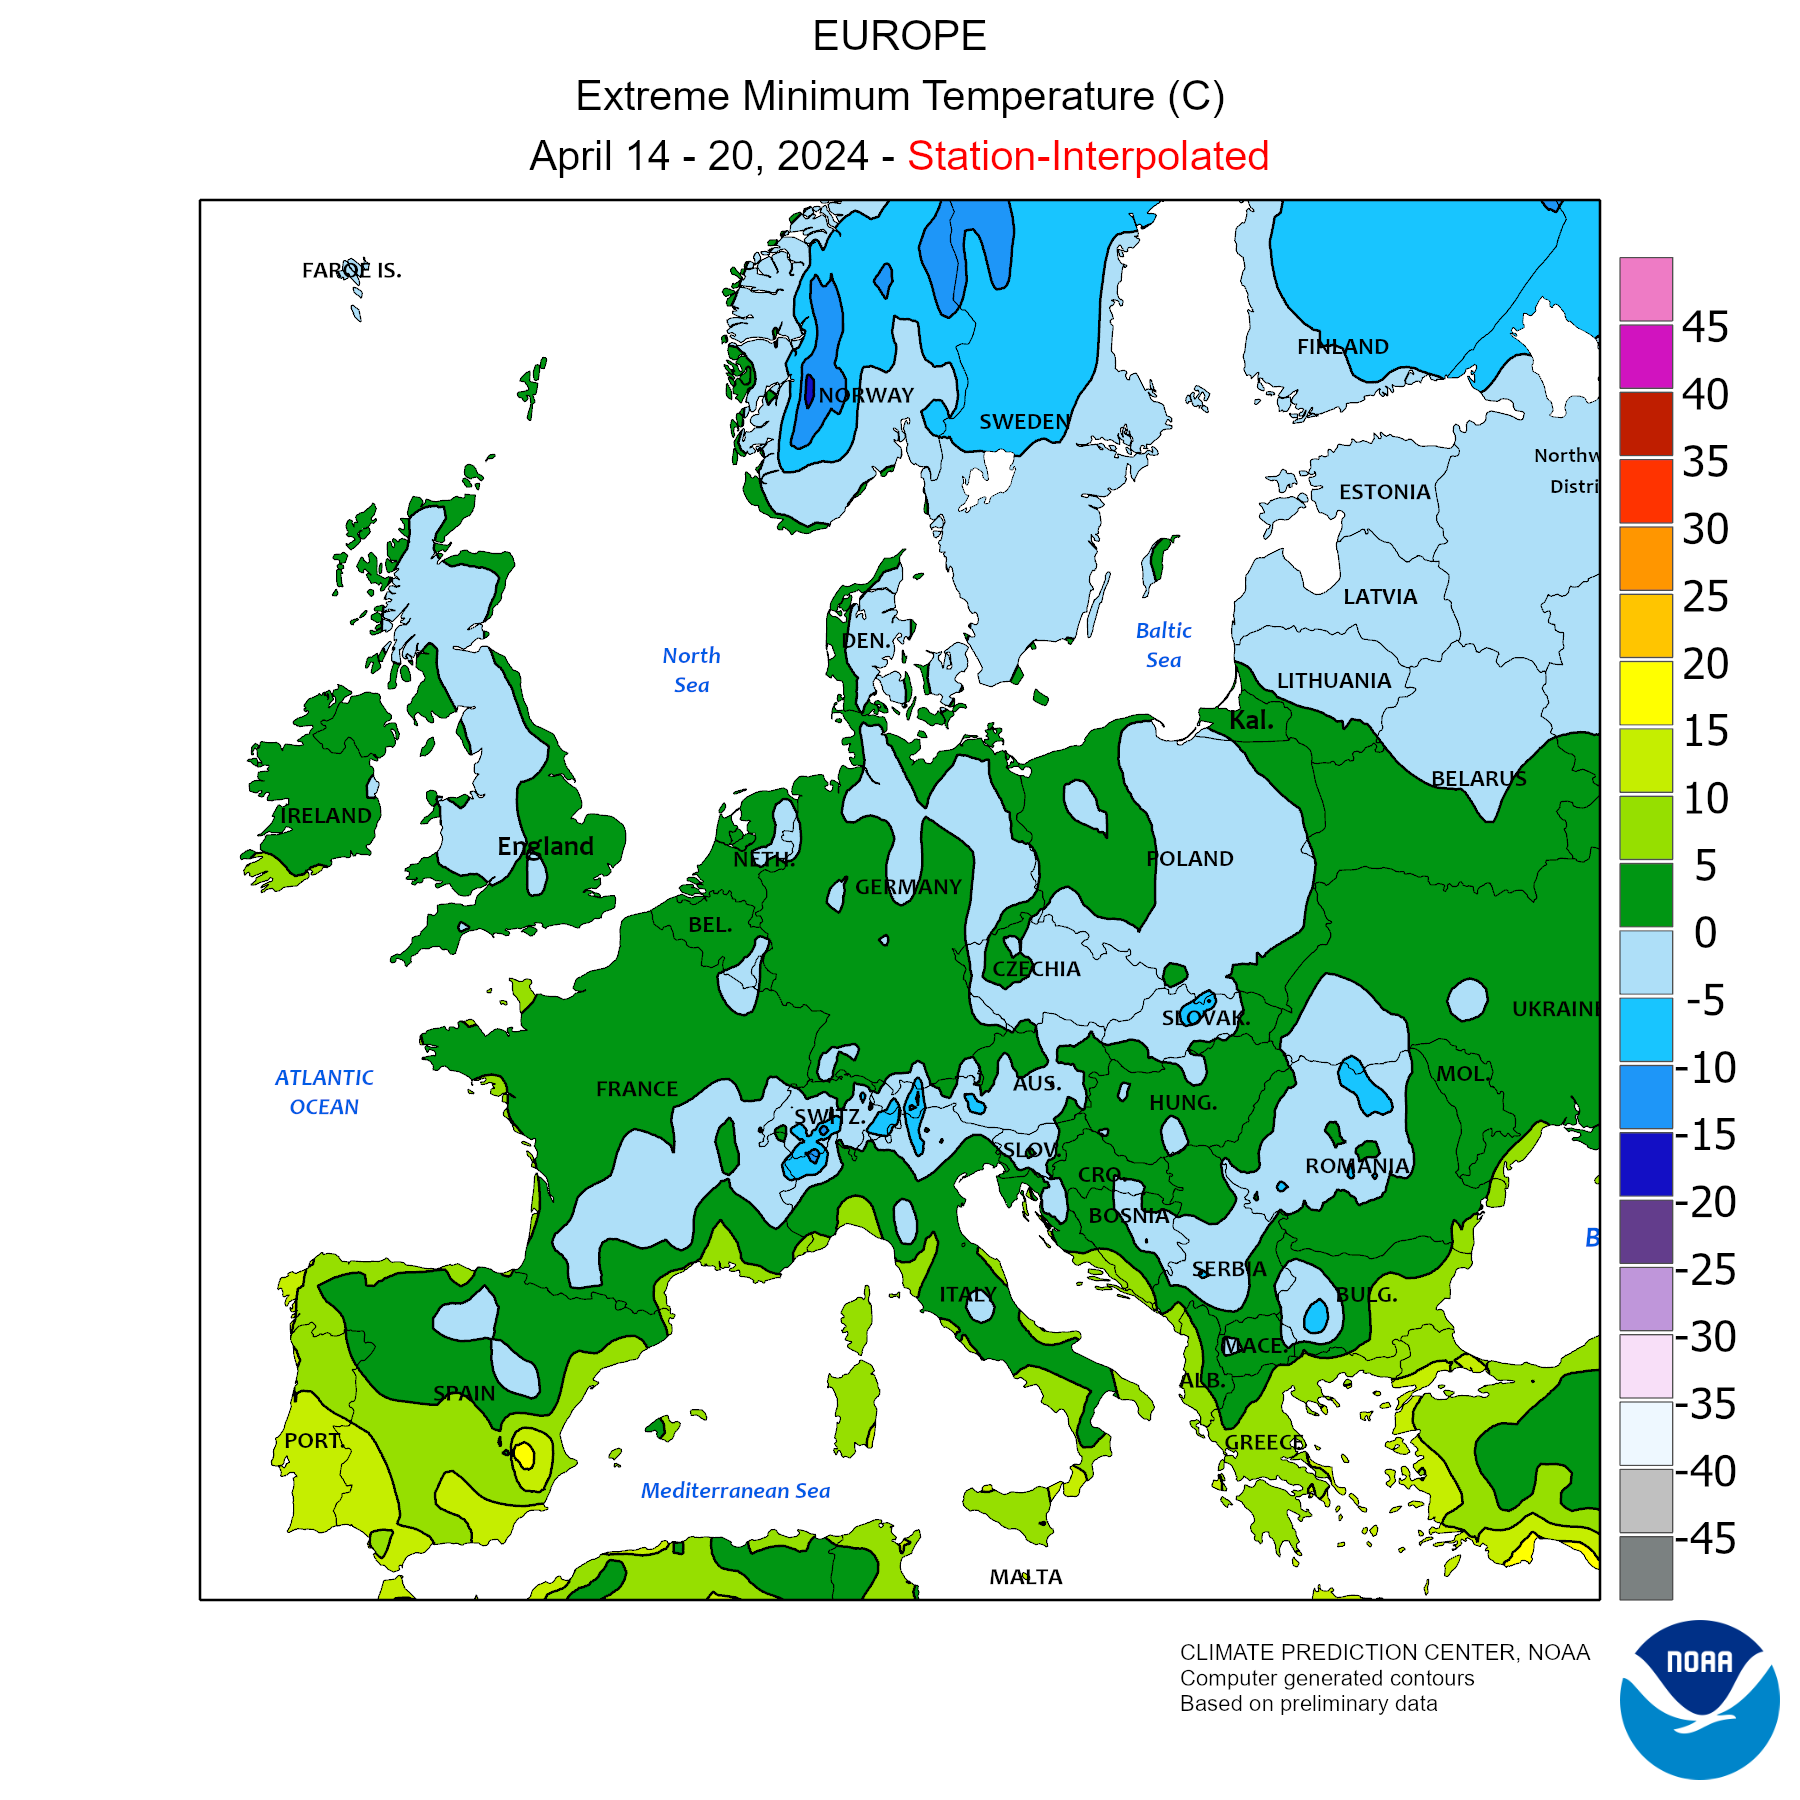
Min Temperature
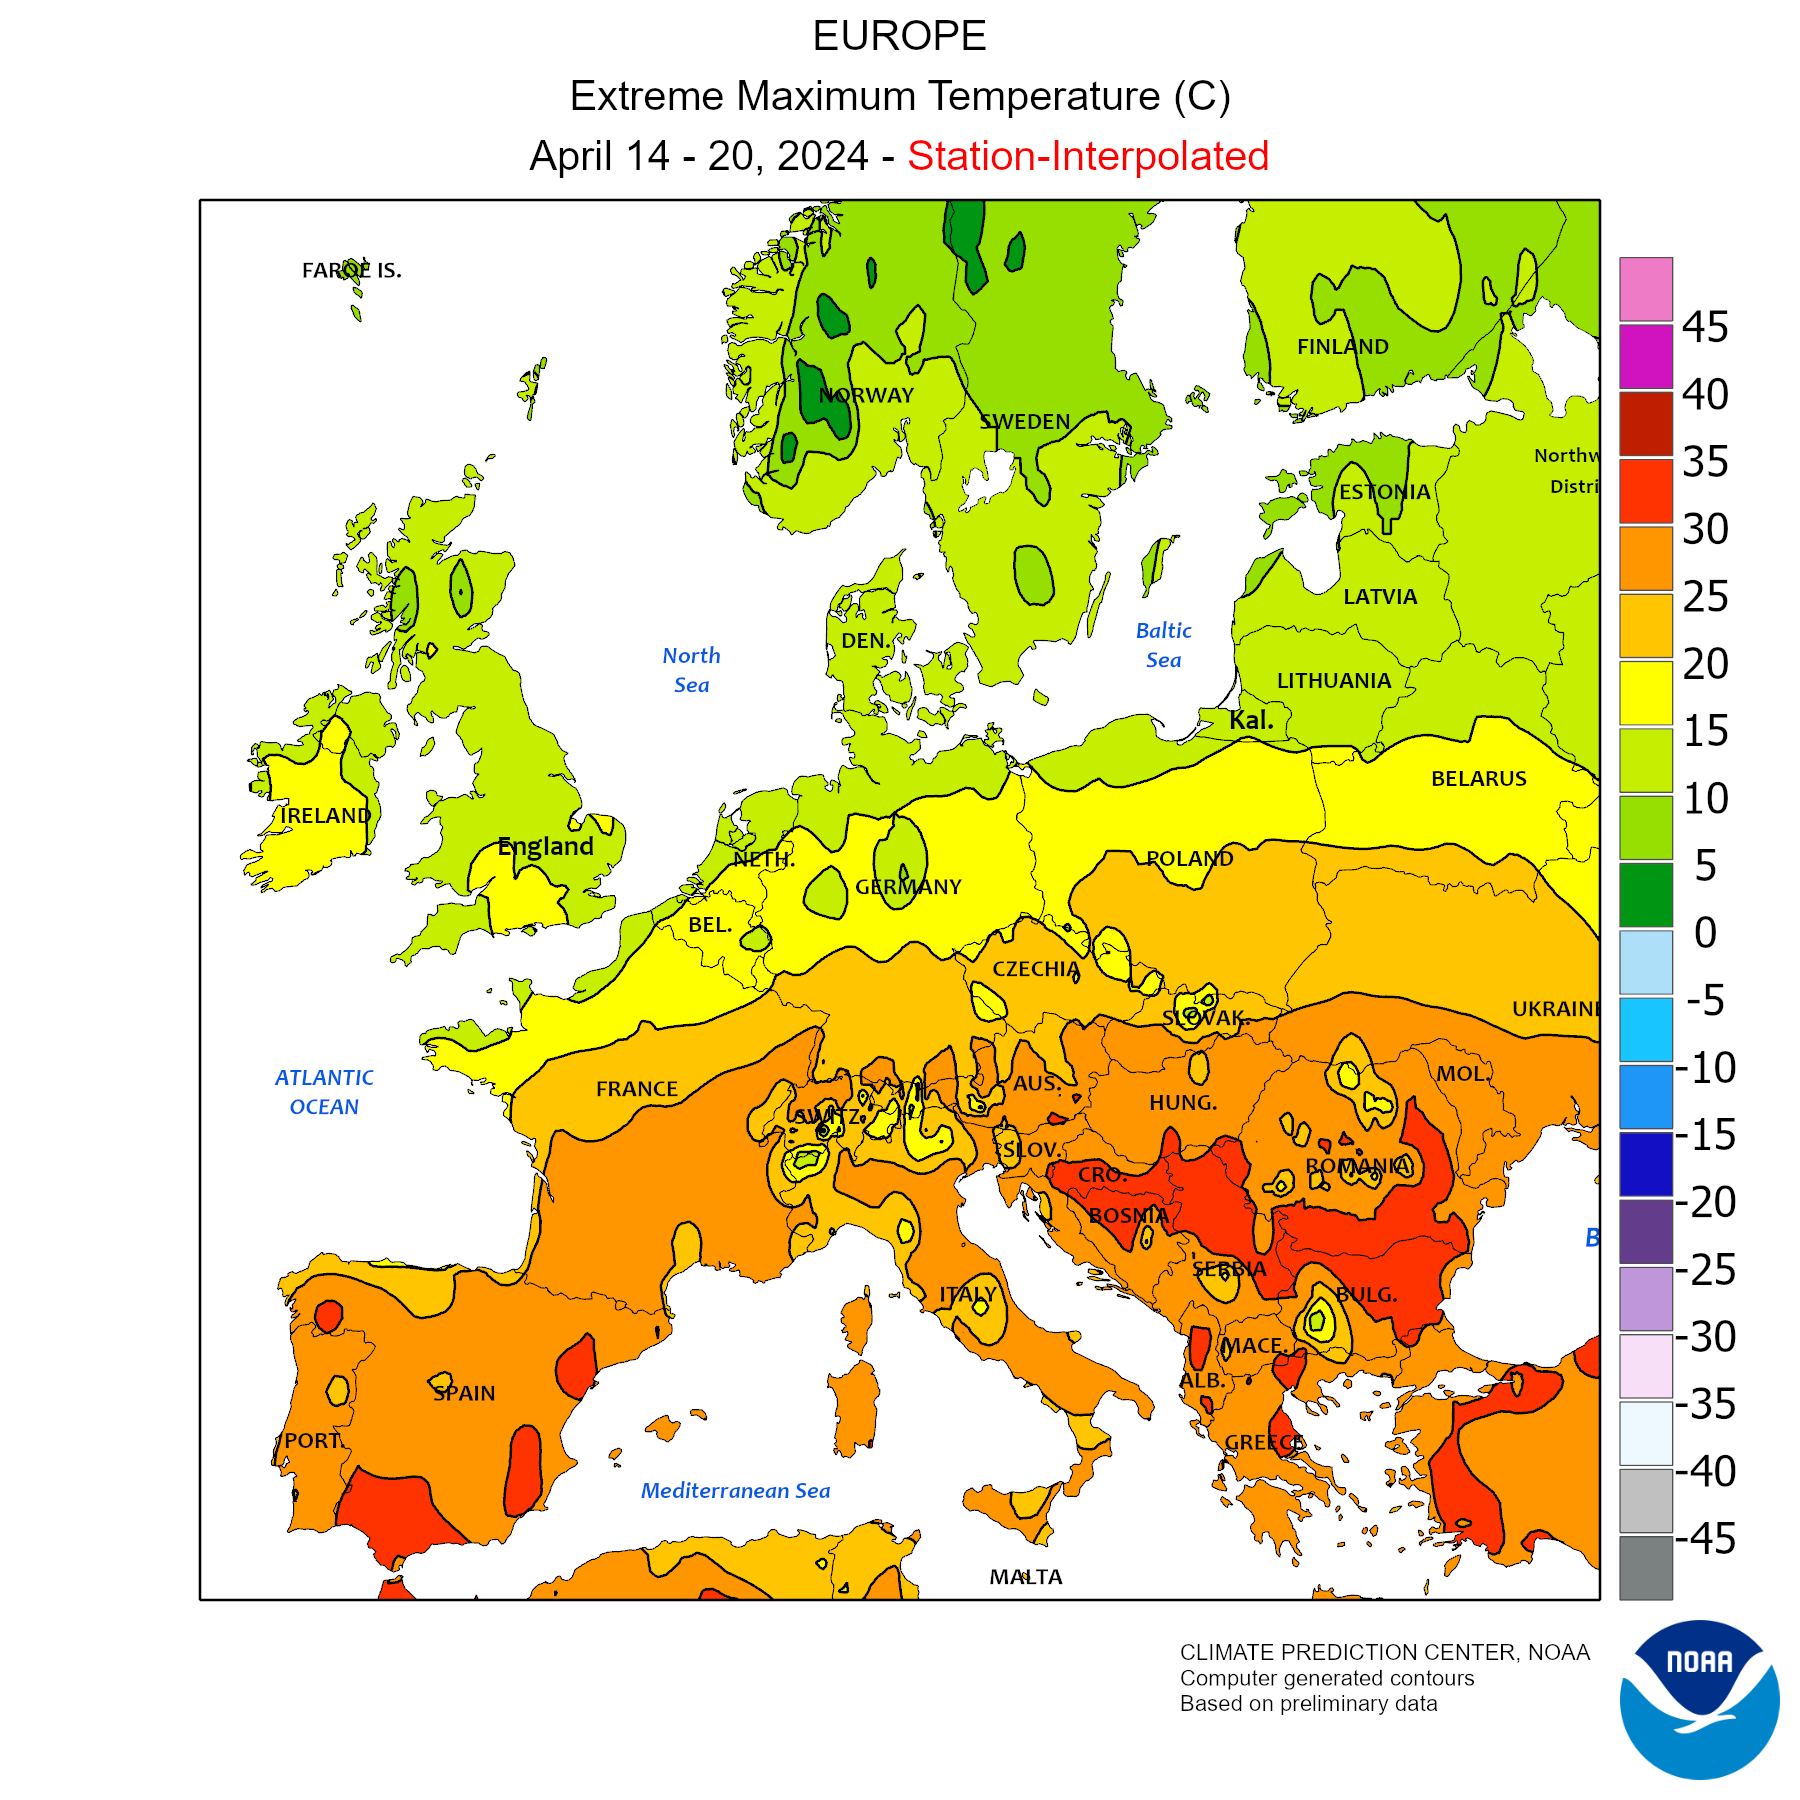
Max Temperature
×
×
×
×
| FRANCE: DAIRY SECTOR | |||||||||
| x 1.000 ton | |||||||||
| RAW MATERIAL AREA | 2020 | 2021 | 2022 | 2023 | 2023 | 2024 | % | Period | |
| Cow's Milk | |||||||||
| Dairy Farm Structure | |||||||||
| Live bovine animals ('000 Head) | 17.816 | 17.330 | 16.986 | 16.807 | |||||
| of which | |||||||||
| Cows ('000 Head) | 3.406 | 3.322 | 3.231 | 3.165 | |||||
| Slaughtered cows ('000 head) | 1.651 | 1.633 | 1.568 | 1.454 | 258 | 257 | -0,5% | Jan-Feb 2024 | |
| Export of Breeding Heifers (HS 01022110 - head) | 46.415 | 23.183 | 41.553 | 30.218 | 3.655 | 835 | -77,2% | Jan 2024 | |
| Import of Breeding Heifers (HS 01022110 - head) | 1.893 | 412 | 1.603 | 12.660 | 317 | 3.907 | >1000% | Jan 2024 | |
| Milk production | 25.235 | 24.781 | 23.988 | ||||||
| ± % Over the same period of the previous year | -1,8% | -3,2% | |||||||
| Raw cows' milk delivered to dairies (Cod. Eurostat D1110D) | 24.602 | 24.200 | 24.057 | 23.423 | 3.960 | 4.032(e) | +1,8% | Jan-Feb 2024 | |
| ± % Over the same period of the previous year | -1,6% | -0,6% | -2,6% | ||||||
| % Delivery on production *** | 97,5% | 97,7% | 100,3% | ||||||
| % Protein | 3,27% | 3,27% | 3,25% | 3,29% | 3,30% | 3,34% | Jan-Feb 2024 | ||
| % Fat | 4,07% | 4,09% | 4,06% | 4,12% | 4,22% | 4,20% | Jan-Feb 2024 | ||
| Sheep milk production (x 1.000 liters) | |||||||||
| Goat milk production (x 1.000 liters) | |||||||||
| Farm-gate milk prices** m.g. 3,8% p.v. prot. 3,2% p.v.(€ per 100 lt, + IVA) | 34,77 | 36,33 | 43,66 | 46,05 | 48,15 | 45,21 | -6,1% | Jan-Feb 2024 | |
| ± % Over the same period of the previous year | +4,5% | +20,2% | +5,5% | ||||||
| Organic Milk Deliveries ('000 Ton) | 1.153 | 1.290 | 1.332 | 1.271 | 207 | 199 | -3,8% | Jan-Feb 2024 | |
| Organic cow milk prices*** (€ per 100 lt, + IVA) | 46,49 | 46,12 | 46,71 | 49,16 | 50,19 | 50,07 | -0,2% | Jan-Feb 2024 | |
| Goat's - Sheep's Milk | |||||||||
| Goats ('000) | 1.414 | 1.388 | 1.311 | 1.275 | |||||
| Goat's Milk Production (Cod.Eurostat D1130A) | 710 | 718 | 743 | - | |||||
| Goat Milk Deliveries ('000 Ton) | 522 | 526 | 537 | 533 | 62 | 61 | -1,5% | Jan-Feb 2024 | |
| Goat Milk Prices (€ per 100 lt, + IVA) | 76,21 | 79,34 | 85,24 | 92,53 | 96,03 | 99,90 | +4,0% | Jan-Feb 2024 | |
| Sheeps ('000) | 6.999 | 6.995 | 6.598 | 6.576 | |||||
| Sheep's Milk Production (Cod.Eurostat D1120A) | 344 | 350 | 343 | - | |||||
| Sheep Milk Deliveries ('000 Ton) | 308 | 311 | 305 | 302 | 75 | 73 | -3,5% | Jan-Feb 2024 | |
| DAIRY PRODUCTION | 2020 | 2021 | 2022 | 2023 | 2023 | 2024 | % | Period | |
| Drinking milk (Cod. Eurostat D2100) | 3.068 | 2.802 | 2.687 | 2.673 | 479 | 480 | +0,1% | Jan-Feb 2024 | |
| Cream for direct consumption (Cod. Eurostat D2200V) | 535 | 548 | 548 | 561 | 98 | 98 | 0,0% | Jan-Feb 2024 | |
| Acidified milk (yoghurts and other) (Cod. Eurostat D4100) | 1.415 | 1.347 | 1.336 | 1.343 | 217 | 230 | +6,1% | Jan-Feb 2024 | |
| Butter (Cod. Eurostat D6000) | 413 | 408 | 409 | 403 | 75 | 73 | -2,5% | Jan-Feb 2024 | |
| Rendered butter and butteroil (Cod.Eurostat D6200) | 44 | 40 | 43 | - | |||||
| Other Yellow Fat Dairy Products (Cod. Eurostat D6900) | 21 | 19 | 21 | - | |||||
| Total Cheese (Cod. Eurostat D7100) | 1.862 | 1.880 | 1.910 | - | |||||
| I° Classificazione | |||||||||
| - Soft cheese ( Cod. Eurostat D7111) | 498 | 488 | 532 | - | |||||
| - Medium soft cheese ( Cod. Eurostat D7112) | 398 | 408 | 401 | - | |||||
| - Hard cheese ( Cod. Eurostat D7114) | 346 | 346 | 337 | - | |||||
| - Fresh cheese ( Cod. Eurostat D7116) | 621 | 639 | 639 | - | |||||
| 2° Classificazione | |||||||||
| - Cheese from cows'milk (pure) ( Cod. Eurostat D7121) | 1.683 | 1.698 | 1.729 | - | |||||
| - Cheese from ewes milk (pure) ( Cod. Eurostat D7122) | 67 | 69 | 67 | - | |||||
| - Cheese from goats milk (pure) ( Cod. Eurostat D7123) | 89 | 90 | 89 | - | |||||
| - Others (cheese from buffalos'milk (pure) or mixed cheese) ( Cod. Eurostat D7129) | 22 | 23 | 24 | - | |||||
| Cheese from cows' milk (Cod. Eurostat D7121) | 1.671 | 1.717 | 1.729 | 1.715 | 281 | 295 | +4,9% | Jan-Feb 2024 | |
| Processed Cheese (Cod. Eurostat D7200) | 141 | 133 | 128 | - | |||||
| Concentrated milk (Cod. Eurostat D3200) | 127 | 125 | 69 | 57 | 10 | 11 | +4,5% | Jan-Feb 2024 | |
| WMP - Milk and cream powders (excl. SMP) (Cod. Eurostat D3100_X_3113) | 129 | 127 | 119 | 113 | 20 | 20 | +0,1% | Jan-Feb 2024 | |
| Partly Skimmed Milk Powder (Cod. Eurostat D3112) | 37 | 32 | 34 | - | |||||
| SMP - Skimmed milk powder (SMP) (Cod. Eurostat D3113) | 409 | 404 | 380 | 363 | 62 | 64 | +3,1% | Jan-Feb 2024 | |
| Buttermilk Powder (Cod. Eurostat D3130) | 26 | 28 | 27 | - | |||||
| Drinks with a milk base (Cod. Eurostat D9100) | 60 | 74 | 75 | - | |||||
| Whey(Cod. Eurostat D5000) | 2.884 | 3.345 | 3.322 | - | |||||
| of which | |||||||||
| Whey (in powder or in block) (Cod. Eurostat D5300) | 412 | 480 | 477 | - | |||||
| Caseins and caseinates (Cod. Eurostat D9300) | 39 | 38 | 64 | - | |||||
| Other fresh products (milk-based desserts, ice cream) (Cod. Eurostat D9200) | 688 | 675 | 707 | - | |||||
| EXPORT | 2020 | 2021 | 2022 | 2023 | Jan | of which Extra EU | 2023 2024 % | 2023 2024 % | |
| Cheese (0406) | TOP importers | 657 | 665 | 666 | 657 | 50 56 +11,3% | 19 21 +8,6% | ||
| Latte Sfuso (04011090+04012019+04012099) | TOP importers | 476 | 391 | 428 | 402 | 34 42 +23,3% | 7,8 7,9 +1,2% | ||
| Whole (04012099) | TOP importers | 353 | 297 | 321 | 329 | 27 28 +3,4% | 6,1 3,7 -38,6% | ||
| Semi-skimmed (04012019) | TOP importers | 0,6 | 0,3 | 1,5 | 0,9 | 0,0 0,2 +605,6% | 0,0 0,1 >1000% | ||
| Skimmed (04011090) | TOP importers | 123 | 94 | 106 | 72 | 7,0 14 +97,3% | 1,7 4,0 +135,5% | ||
| Yogurt and buttermilk (0403) | TOP importers | 340 | 332 | 326 | 337 | 26 30 +16,2% | 12 13 +6,8% | ||
| Whey (0404) | TOP importers | 368 | 396 | 324 | 317 | 24 24 -1,1% | 13 13 +0,4% | ||
| Sweet dairy Whey (12% protein) and WPC (040410) | TOP importers | 307 | 326 | 264 | 259 | 21 20 -8,0% | 13 13 +0,3% | ||
| SMP (040210) | TOP importers | 264 | 273 | 228 | 233 | 19 18 -5,7% | 12 9,3 -25,2% | ||
| Cream (040130+040140+040150) | TOP importers | 176 | 189 | 175 | 229 | 17 22 +31,6% | 8,6 9,1 +5,0% | ||
| Fat-Filled Milk Powder (FFMP) (190190) | TOP importers | 171 | 204 | 240 | 202 | 18 16 -9,5% | 11 9,9 -7,6% | ||
| Infant milk formula (190110) | TOP importers | 175 | 154 | 163 | 165 | 15 13 -12,5% | 11 9,0 -15,3% | ||
| Butter And Other Fats (0405) | TOP importers | 92 | 100 | 100 | 106 | 8,8 11 +24,8% | 5,0 6,0 +19,3% | ||
| Anhydrous Milk Fat (040590) | TOP importers | 17 | 21 | 17 | 20 | 1,5 2,1 +35,4% | 0,6 0,6 +0,4% | ||
| Latte Confezionato (04011010+04012011+04012091) | TOP importers | 278 | 186 | 154 | 102 | 10 7,7 -23,1% | 3,9 4,5 +16,9% | ||
| Whole (04012091) | TOP importers | 101 | 66 | 49 | 29 | 3,1 2,6 -17,4% | 1,4 1,9 +31,2% | ||
| Semi-Skimmed (04012011) | TOP importers | 137 | 93 | 79 | 53 | 5,2 3,6 -30,4% | 2,1 2,2 +5,9% | ||
| Skimmed (04011010) | TOP importers | 41 | 27 | 26 | 20 | 1,8 1,6 -11,8% | 0,4 0,5 +24,1% | ||
| Condensed Milk (040291+040299) | TOP importers | 110 | 106 | 102 | 101 | 6,6 11 +69,0% | 2,0 1,3 -31,9% | ||
| WMP (040221+040229) | TOP importers | 77 | 84 | 75 | 71 | 5,2 6,0 +15,5% | 2,1 2,5 +14,9% | ||
| Other Product | 97 | 94 | 90 | 92 | 7,3 8,4 +14,8% | 4,5 3,9 -12,8% | |||
| Soya-based beverages (protein content >=2,8 %) | 87 | 84 | 58 | 38 | 2,8 2,9 +0,2% | - - - | |||
| Soya-based beverages (protein content of <2.8%) based on nuts, cereals or seeds | 112 | 132 | 152 | 129 | 11 13 +19,7% | - - - | |||
| Non-alcoholic beverages containing < 0,2% fats derived from milk or milk products | 15 | 16 | 18 | 12 | 1,4 1,0 -32,5% | - - - | |||
| IMPORT | 2020 | 2021 | 2022 | 2023 | Jan | of which Extra EU | 2023 2024 % | 2023 2024 % | |
| Cheese (0406) | TOP exporters | 402 | 508 | 458 | 478 | 33 36 +12,0% | 4,3 6,1 +42,4% | ||
| Butter And Other Fats (0405) | TOP exporters | 200 | 216 | 241 | 254 | 20 20 -1,2% | 1,4 0,7 -51,2% | ||
| Anhydrous Milk Fat (040590) | TOP exporters | 20 | 25 | 32 | 29 | 2,7 1,8 -31,9% | 1,0 0,5 -45,4% | ||
| Whey (0404) | TOP exporters | 240 | 265 | 254 | 171 | 15 13 -11,9% | 4,6 4,3 -5,5% | ||
| Sweet dairy Whey (12% protein) and WPC (040410) | TOP exporters | 183 | 213 | 199 | 136 | 11 11 -1,0% | 4,6 4,3 -5,6% | ||
| Cream (040130+040140+040150) | TOP exporters | 148 | 163 | 142 | 151 | 12 12 -2,9% | 1,1 1,2 +9,1% | ||
| Fat-Filled Milk Powder (FFMP) (190190) | TOP exporters | 91 | 112 | 126 | 116 | 8,9 9,1 +1,6% | 2,6 2,1 -20,3% | ||
| Yogurt and buttermilk (0403) | TOP exporters | 96 | 101 | 105 | 105 | 7,6 7,5 -1,2% | 2,3 0,9 -63,1% | ||
| Condensed Milk (040291+040299) | TOP exporters | 47 | 61 | 85 | 79 | 8,0 6,0 -24,8% | 1,0 1,4 +42,8% | ||
| Latte Sfuso (04011090+04012019+04012099) | TOP exporters | 71 | 51 | 71 | 79 | 8,1 6,9 -14,8% | 2,2 1,9 -11,0% | ||
| Whole (04012099) | TOP exporters | 57 | 39 | 59 | 71 | 7,4 6,2 -16,7% | 2,2 1,9 -10,9% | ||
| Semi-skimmed (04012019) | TOP exporters | 9,8 | 7,4 | 8,4 | 4,0 | 0,5 0,4 -22,1% | - - - | ||
| Skimmed (04011090) | TOP exporters | 4,2 | 4,6 | 3,4 | 4,0 | 0,2 0,3 +90,7% | - - - | ||
| Lactose Pharmaceutical (170211) | TOP exporters | 33 | 34 | 39 | 41 | 3,7 3,7 -0,6% | 0,4 0,9 +95,3% | ||
| Infant milk formula (190110) | TOP exporters | 40 | 36 | 41 | 39 | 2,9 2,4 -17,8% | 1,0 0,4 -64,5% | ||
| SMP (040210) | TOP exporters | 35 | 35 | 38 | 36 | 3,4 3,1 -7,2% | 0,5 0,5 -2,1% | ||
| Other Product | 114 | 90 | 67 | 72 | 5,8 6,1 +4,5% | 0,9 0,7 -22,5% | |||
| Soya-based beverages (protein content >=2,8 %) | 13 | 16 | 13 | 11 | 0,7 1,0 +38,5% | - - - | |||
| Soya-based beverages (protein content of <2.8%) based on nuts, cereals or seeds | 60 | 72 | 75 | 74 | 5,6 4,4 -21,2% | - - - | |||
| Non-alcoholic beverages containing < 0,2% fats derived from milk or milk products | 24 | 21 | 24 | 27 | 2,3 1,7 -27,0% | - - - | |||
| % Self-sufficiency rate | 131,7% | 126,7% | 125,7% | 124,7% | 126,6% | Jan 2024 | |||
| SOCIO-ECONOMIC INDICATORS | 2020 | 2021 | 2022 | 2023 | 2023 | 2024(f) | % | Period | |
| GDP (gross domestic product) | -7,68% | 6,36% | 2,53% | 0,87% | 0,87% | 0,70% | Jan-Dic 2024 | ||
| CPI (consumer price index) | 0,52% | 2,07% | 5,91% | 5,66% | 5,66% | 2,60% | Jan-Dic 2024 | ||
| Population ('000) | 67.320 | 67.657 | 67.872 | 68.173 | |||||
| GDP per capita (U.S. dollars) | 40.529 | 45.201 | 42.350 (e) | 46.315 (e) | |||||
| GDP per capita (€) * | 35.460 | 38.217 | 40.217(e) | 42.833(e) | |||||
Informative Note
(f): forecast
(e) estimated
* Per capita GDP in Euro is calculated by using the yearly average exchange rate
** Prix toutes primes comprises, toutes qualités confondues, ramené à un lait standard (38g de MG / 32g de MP).
Ce prix est le prix payé aux producteurs au cours du mois, il peut inclure des avances.
*** Prix du lait bio à la production, toutes primes comprises, toutes qualités confondues, ramené à un un lait standard (38g de MG,32g de MP).
SOURCES
Raw material area: Sheep and Goat Production, Cow Delivery and % Protein e % Fat: Eurostat (dataset: apro_mk_colm); Milk Production: Eurostat (dataset: agr_r_milkpr); Number of cows: Eurostat (dataset: agr_r_animal); Number of Goats, Sheeps and Bufaloes: Eurostat (dataset: apro_mt_lsgoat, apro_mt_lssheep, apro_mt_lscatl ); Sheep and Goat Milk Production: Eurostat (annual data dataset: apro_mk_farm); Farm-gate milk conventional and organic prices: FranceAgriMer, ; Import/Export of Breeding Heifers: IHS ; Organic Milk Production: Eurostat (dataset: org_aprod);
Dairy production: (annual data dataset: apro_mk_pobta, monthly data dataset: apro_mk_colm)
Export: Eurostat
Import: Eurostat
GDP and CPI: Intesa Sanpaolo
GDP per capita: International Monetary Found
Population: Eurostat
*** MILK DELIVERIES AND MILK PRODUCTION
Note: Self-sufficiency rate = Milk deliveries/(Domestic use in milk equivalent ME)
Domestic use in milk equivalent (ME) = Milk deliveries + Import in ME - Export in ME
The Self-sufficiency rate does not consider the trade of FFMP (fat-filled milk powder) - HS 190190 and the infant milk formula.
Last update: 02-05-2024
(e) estimated
* Per capita GDP in Euro is calculated by using the yearly average exchange rate
** Prix toutes primes comprises, toutes qualités confondues, ramené à un lait standard (38g de MG / 32g de MP).
Ce prix est le prix payé aux producteurs au cours du mois, il peut inclure des avances.
*** Prix du lait bio à la production, toutes primes comprises, toutes qualités confondues, ramené à un un lait standard (38g de MG,32g de MP).
SOURCES
Raw material area: Sheep and Goat Production, Cow Delivery and % Protein e % Fat: Eurostat (dataset: apro_mk_colm); Milk Production: Eurostat (dataset: agr_r_milkpr); Number of cows: Eurostat (dataset: agr_r_animal); Number of Goats, Sheeps and Bufaloes: Eurostat (dataset: apro_mt_lsgoat, apro_mt_lssheep, apro_mt_lscatl ); Sheep and Goat Milk Production: Eurostat (annual data dataset: apro_mk_farm); Farm-gate milk conventional and organic prices: FranceAgriMer, ; Import/Export of Breeding Heifers: IHS ; Organic Milk Production: Eurostat (dataset: org_aprod);
Dairy production: (annual data dataset: apro_mk_pobta, monthly data dataset: apro_mk_colm)
Export: Eurostat
Import: Eurostat
GDP and CPI: Intesa Sanpaolo
GDP per capita: International Monetary Found
Population: Eurostat
*** MILK DELIVERIES AND MILK PRODUCTION
- Milk deliveries (apro_mk_colm): milk collected by dairies (located in the Member State) from the agricultural holdings (within or outside the Member State).
- Milk production (agr_r_milkpr): milk produced by agricultural holdings (located in the Member State) and a part of this milk is delivered to dairies (within or outside the Member State).
Note: Self-sufficiency rate = Milk deliveries/(Domestic use in milk equivalent ME)
Domestic use in milk equivalent (ME) = Milk deliveries + Import in ME - Export in ME
The Self-sufficiency rate does not consider the trade of FFMP (fat-filled milk powder) - HS 190190 and the infant milk formula.
Last update: 02-05-2024
NOTA: Access to Dairy World Trade,
which also contains the processing of Import / Export of the France with MONTHLY UPDATES,
is reserved for Supporters of CLAL.it