


.jpg)


.jpg)


Hungary: Dairy sector
This Country:
- accounts for 1,1% of EU milk deliveries (year 2023),
- exports dairy products, converted into milk equivalent (ME), for the 39,5% of the milk deliveries (year 2022),
- accounts for 0,8% of EU dairy exports in ME (year 2023).
The orange links allow a further analysis on TESEO.
![]()
![]()
![]()
![]()
Latest climate weekly reports about precipitations and temperatures.
Total Precipitation: level of rainfall;
Temperature anomalies: variation compared to historical mean temperature;
Min Temperature: minimum temperature;
Max Temperature: maximum temperature;
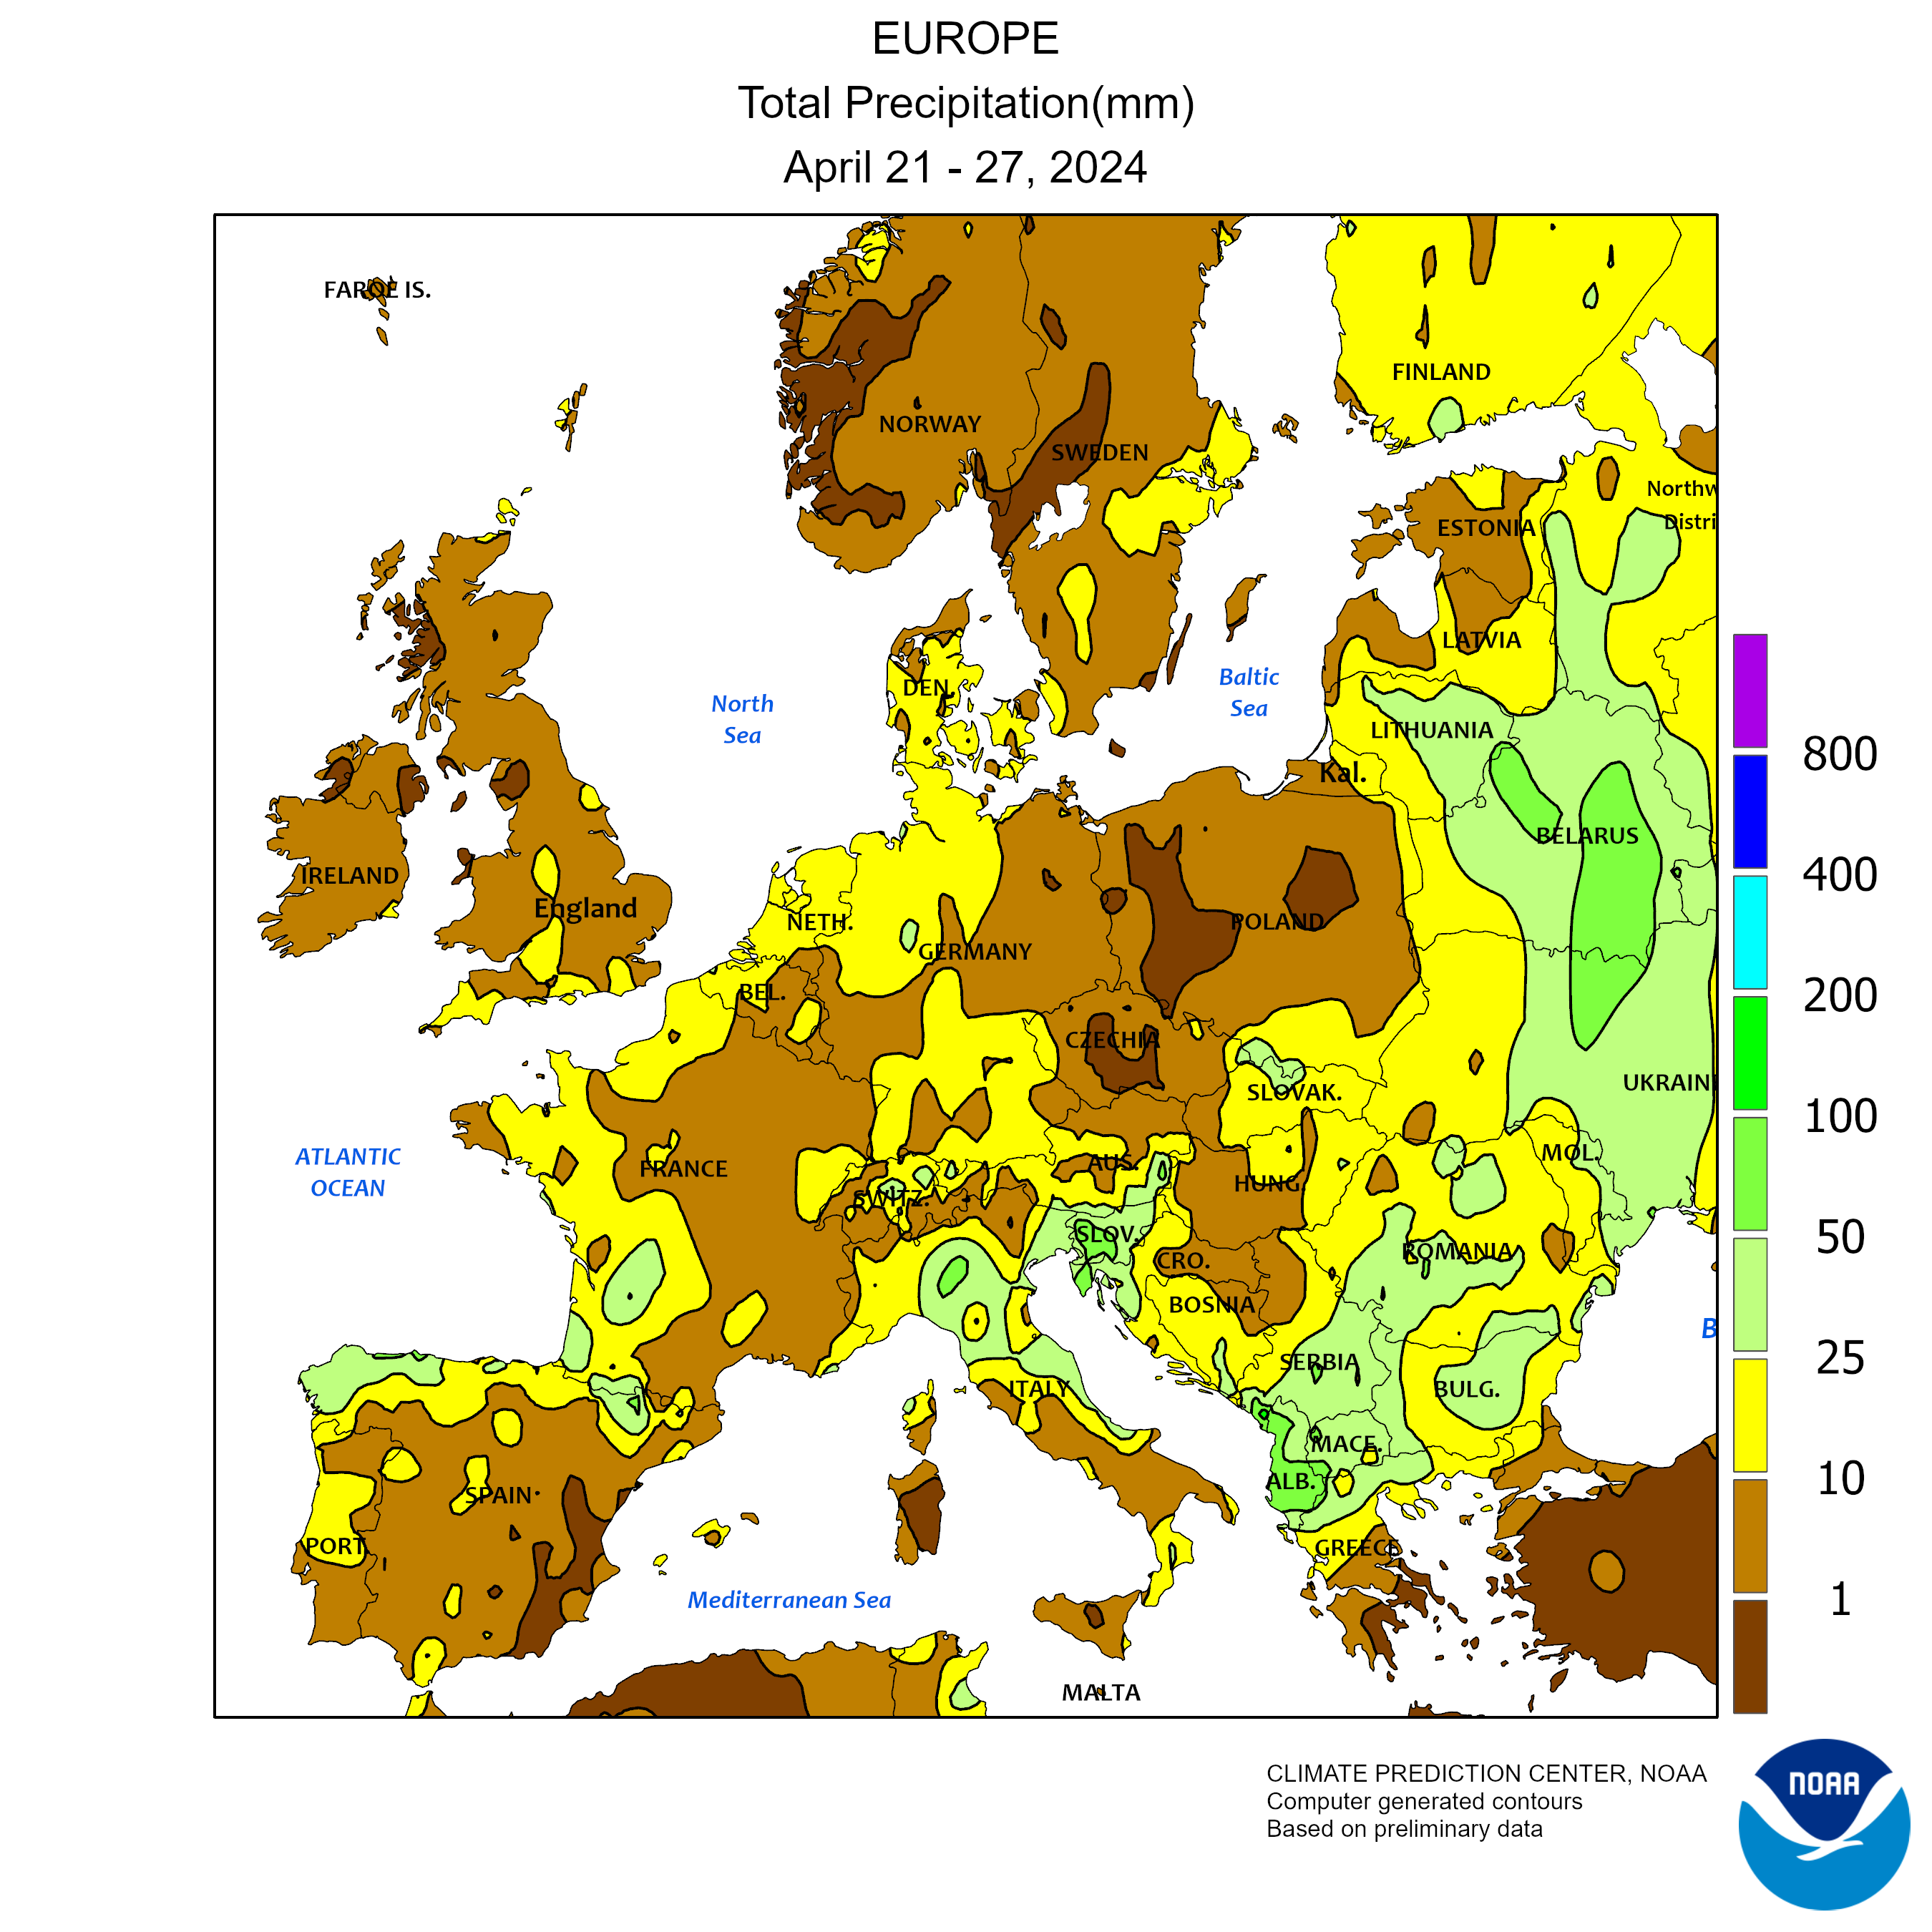
Total Precipitation
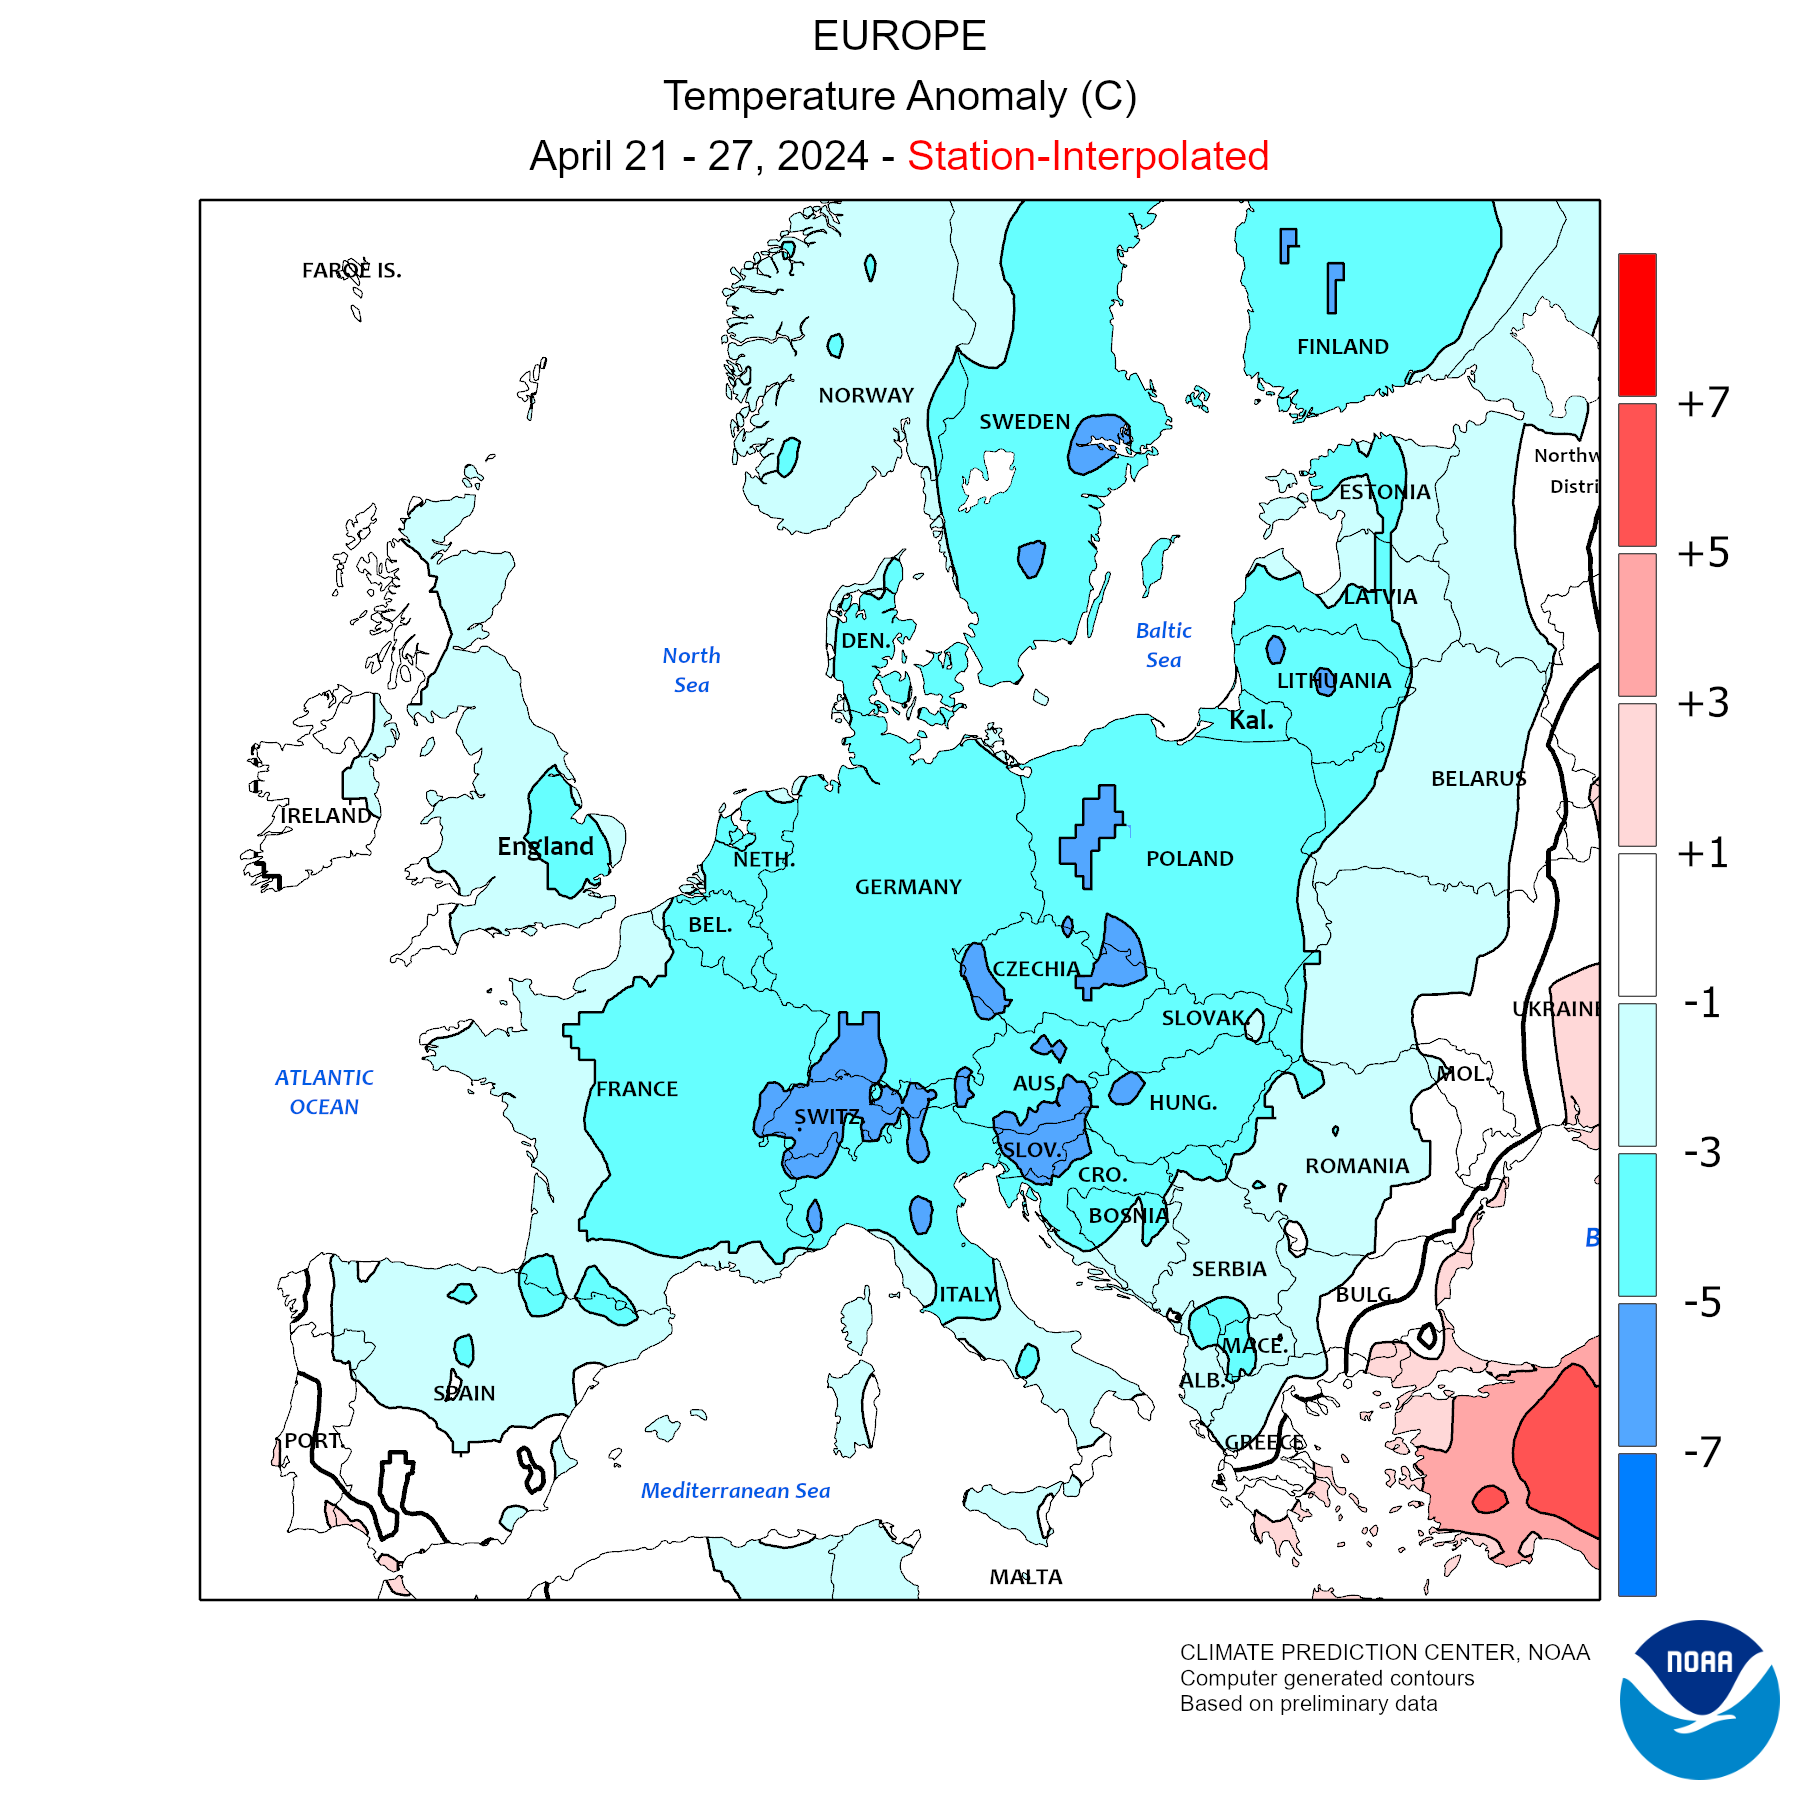
Temperature anomalies
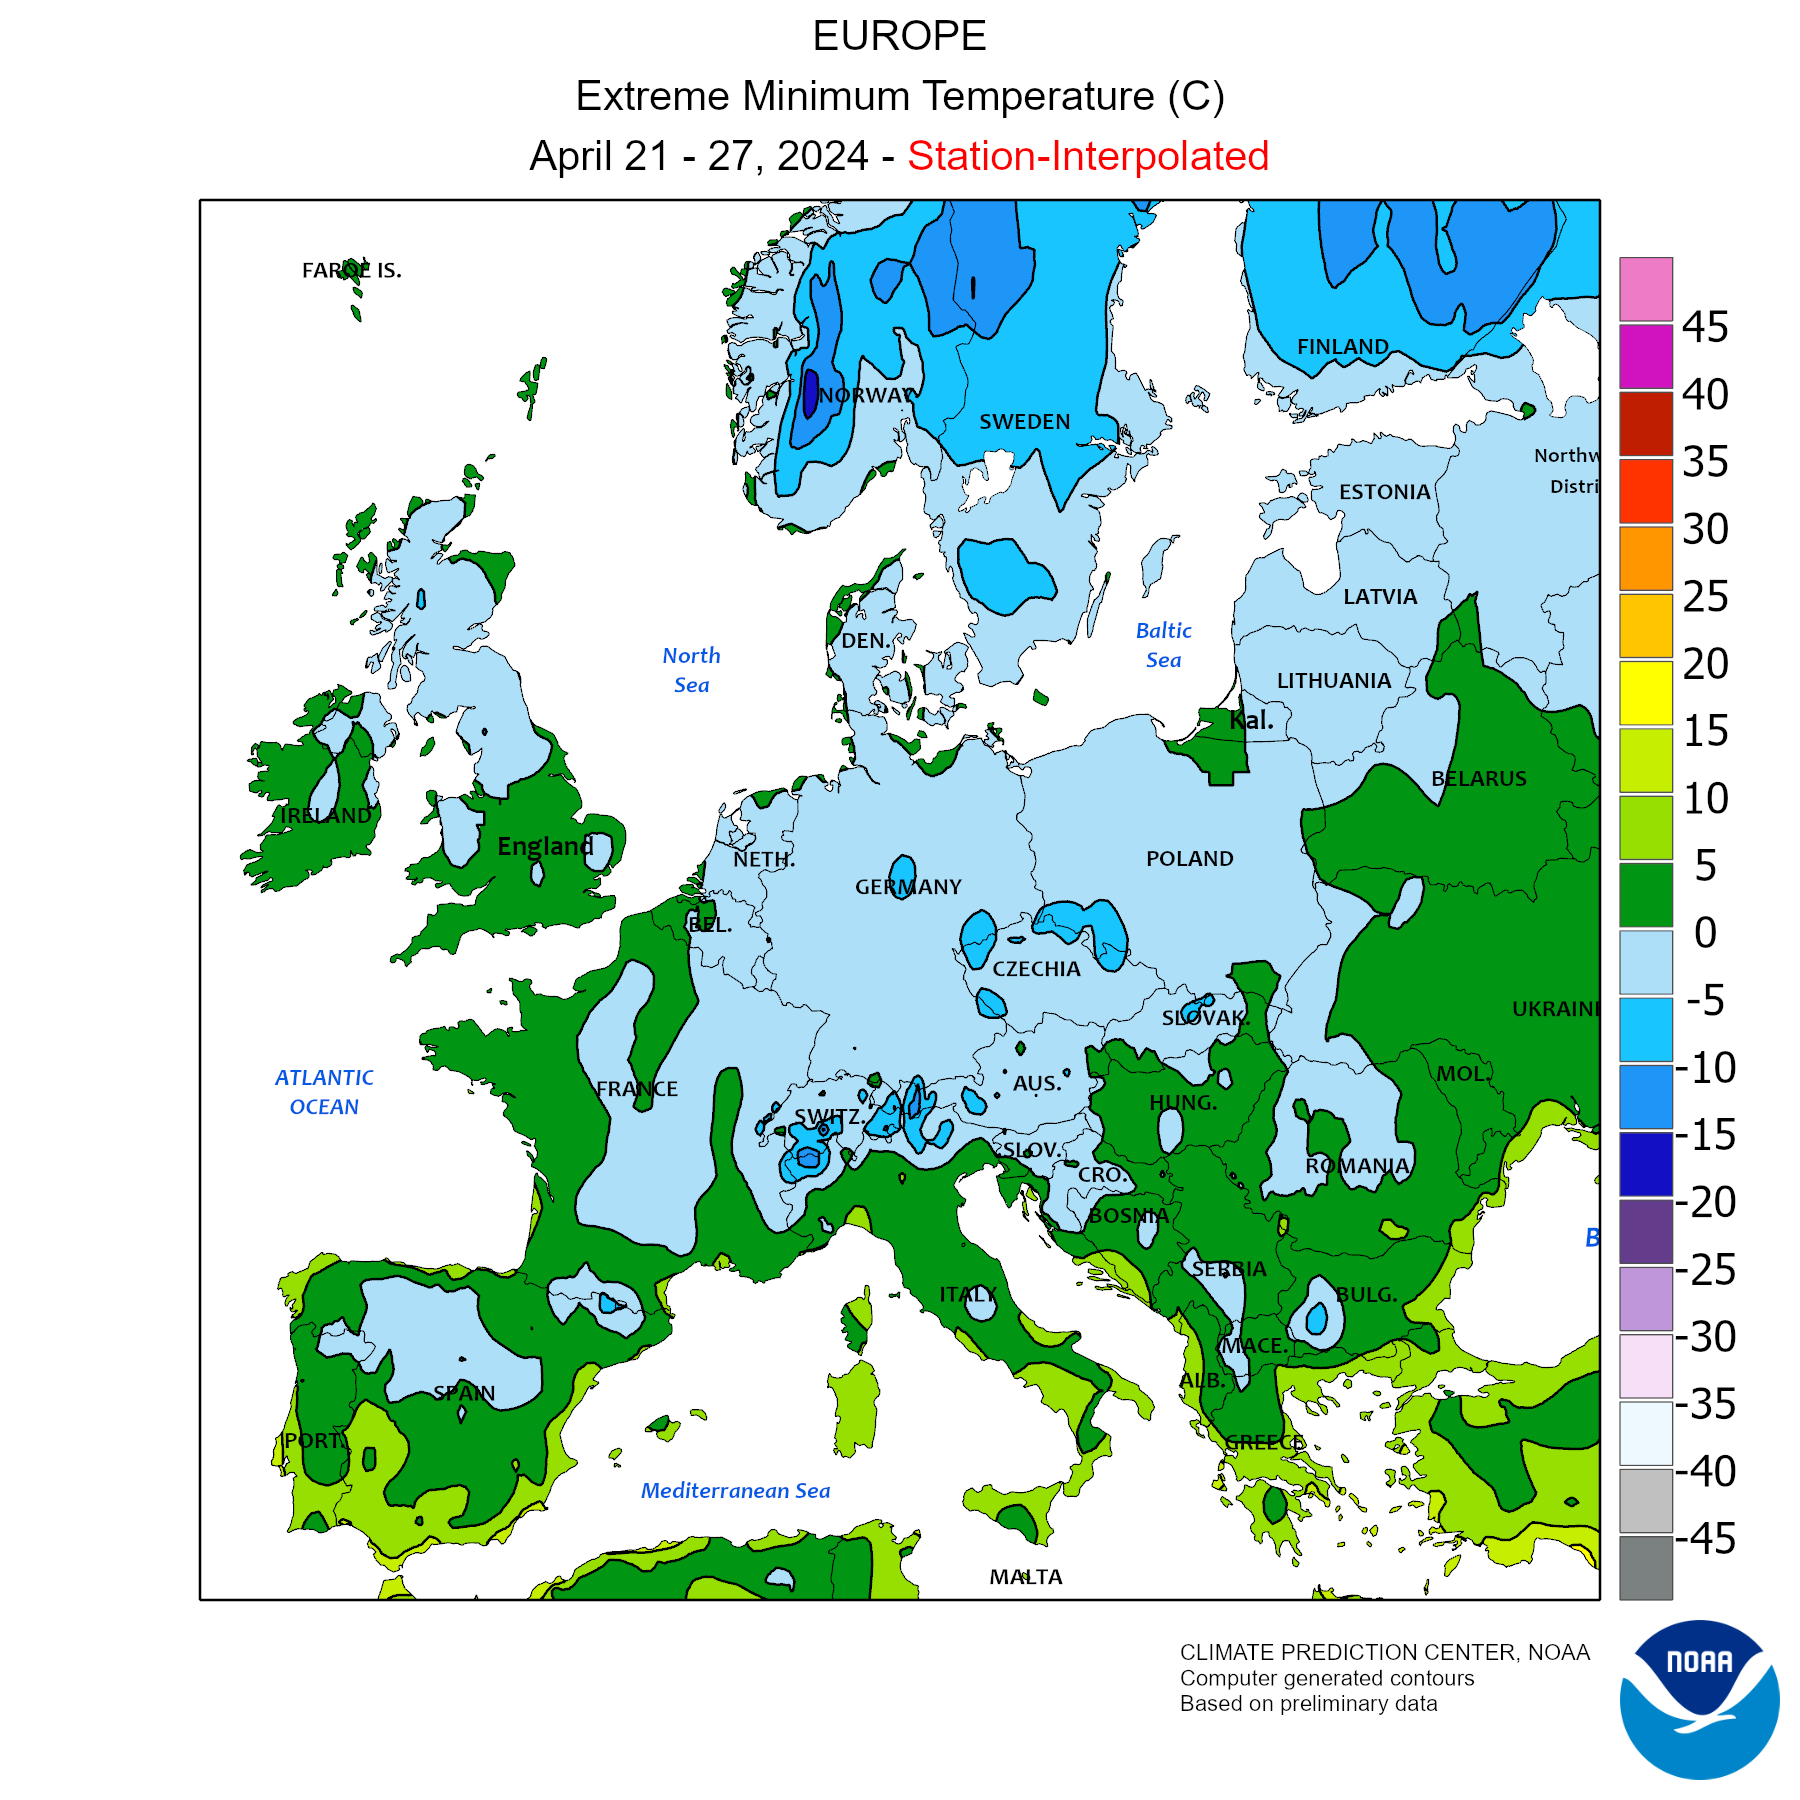
Min Temperature
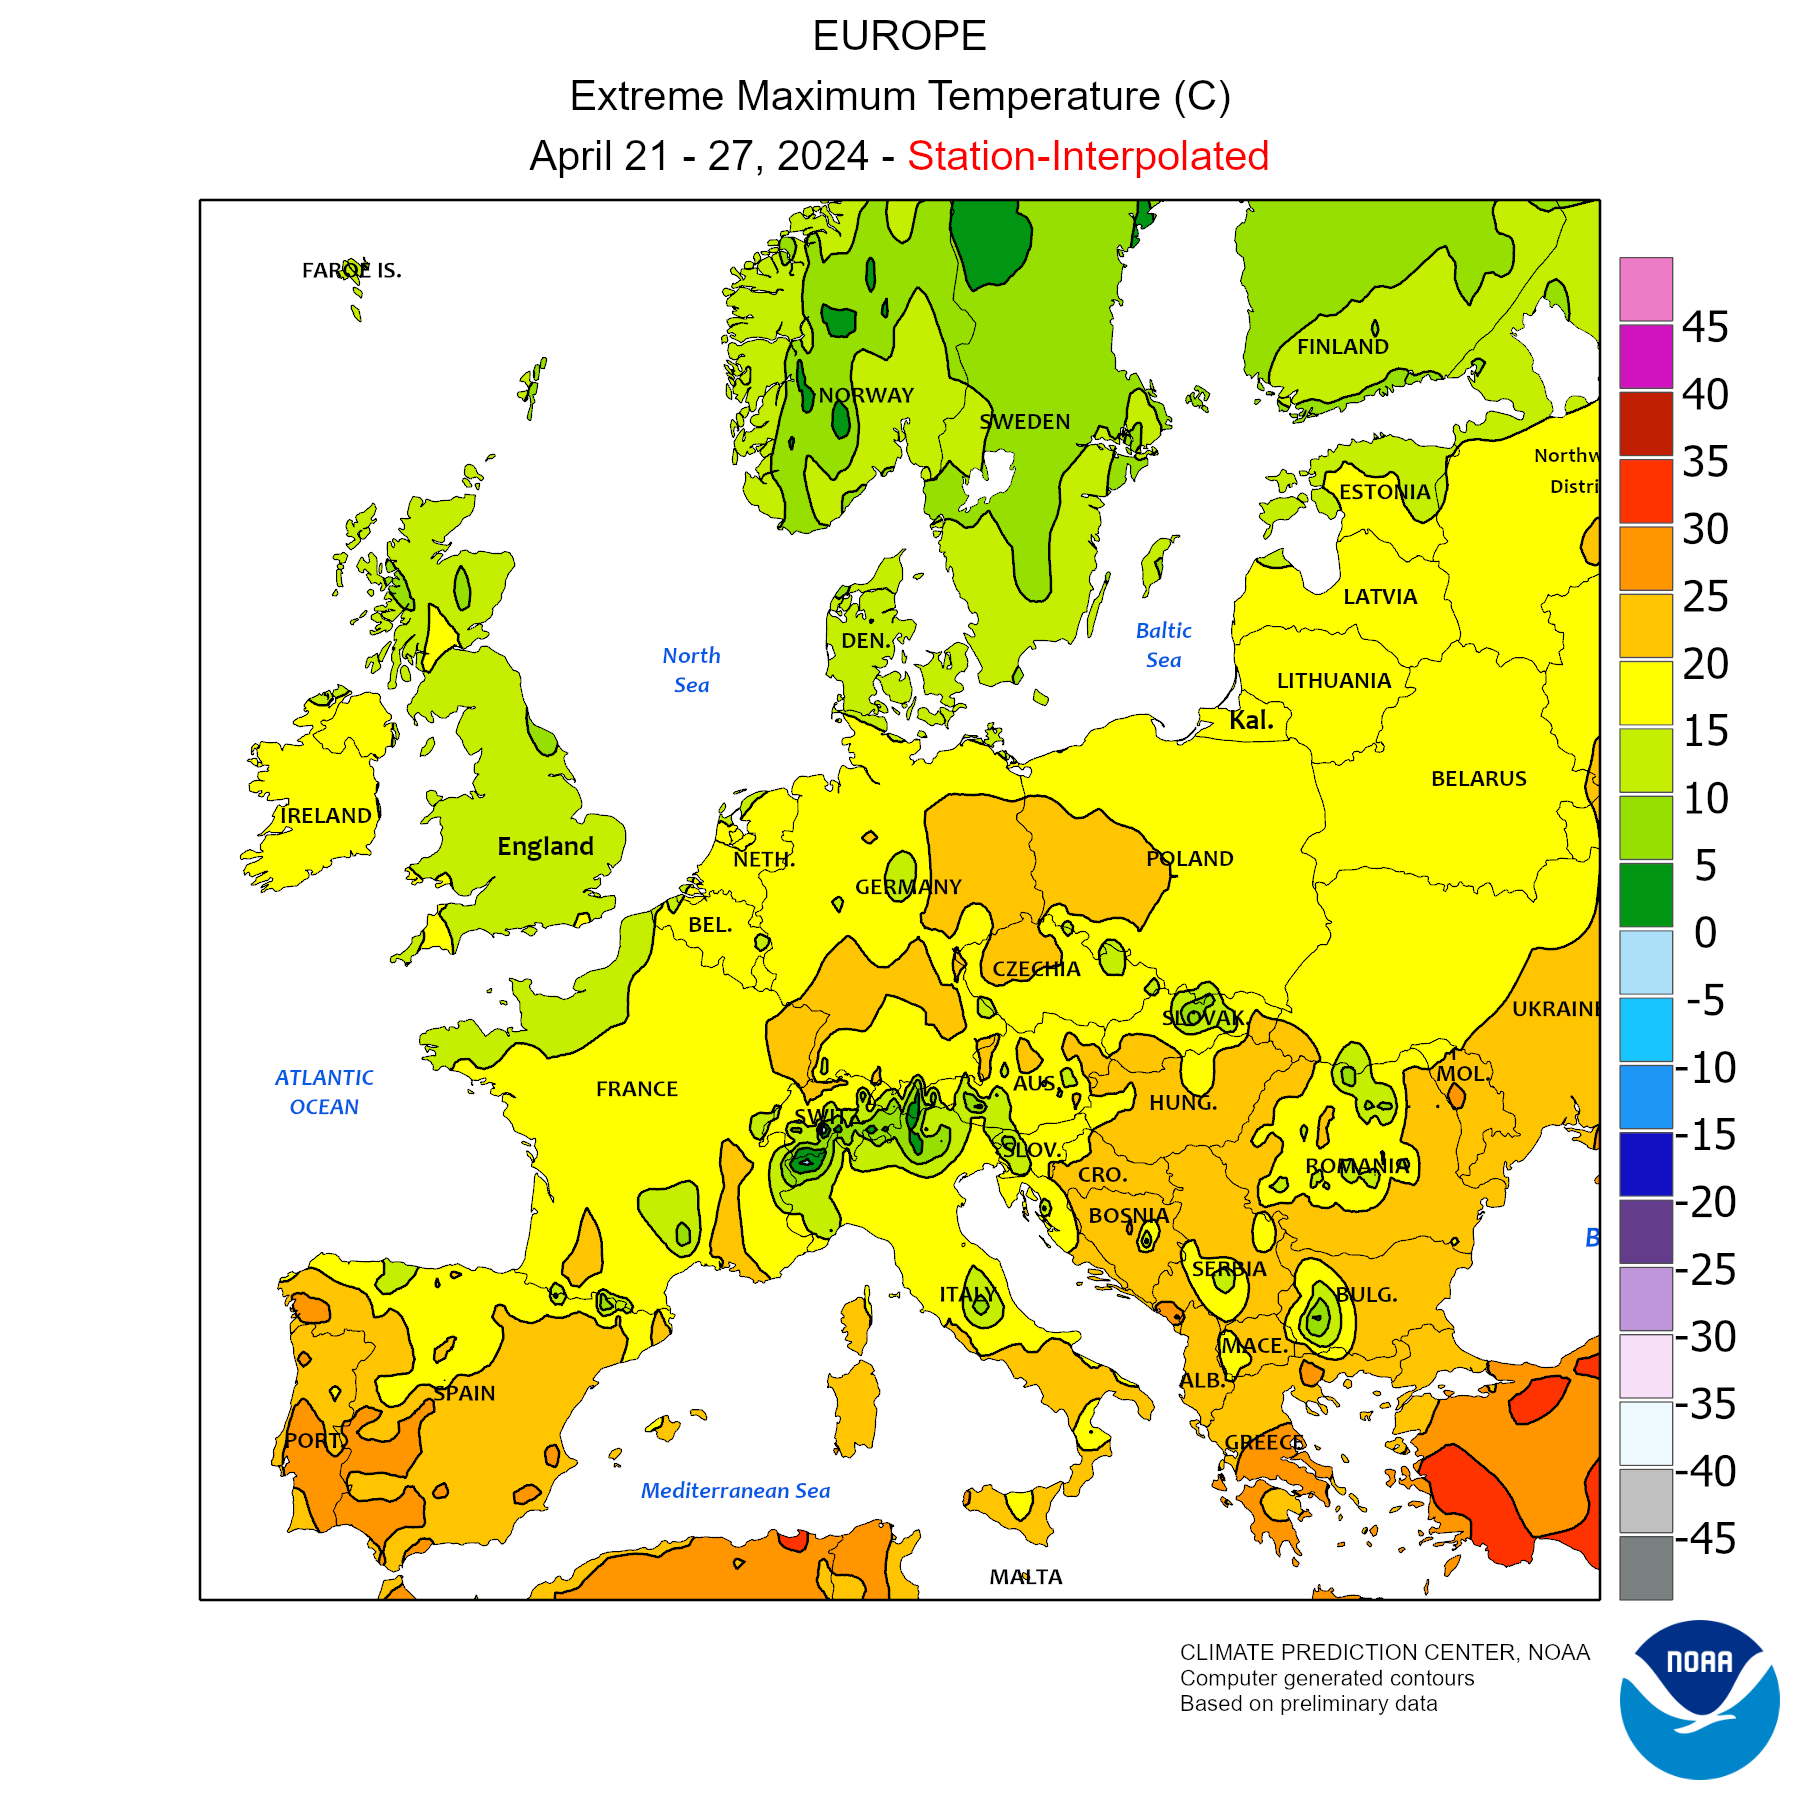
Max Temperature
×
×
×
×
| HUNGARY: DAIRY SECTOR | |||||||||
| x 1.000 ton | |||||||||
| RAW MATERIAL AREA | 2020 | 2021 | 2022 | 2023 | 2023 | 2024 | % | Period | |
| Cow's Milk | |||||||||
| Dairy Farm Structure | |||||||||
| Live bovine animals ('000 Head) | 933 | 910 | 894 | 870 | |||||
| of which | |||||||||
| Cows ('000 Head) | 247 | 281 | 278 | 266 | |||||
| Slaughtered cows ('000 head) | 67 | 67 | 61 | 55 | 13 | 11 | -17,0% | Jan-Mar 2024 | |
| Export of Breeding Heifers (HS 01022110 - head) | 54.993 | 27.626 | 29.894 | 34.701 | 3.550 | 2.083 | -41,3% | Jan 2024 | |
| Import of Breeding Heifers (HS 01022110 - head) | 9.928 | 10.136 | 19.697 | 27.331 | 1.899 | 1.371 | -27,8% | Jan 2024 | |
| Milk production | 2.014 | 2.080 | 2.040 | ||||||
| ± % Over the same period of the previous year | +3,3% | -1,9% | |||||||
| Raw cows' milk delivered to dairies (Cod. Eurostat D1110D) | 1.626 | 1.739 | 1.700 | 1.652 | 424 | 438 | +3,3% | Jan-Mar 2024 | |
| ± % Over the same period of the previous year | +7,0% | -2,2% | -2,8% | ||||||
| % Delivery on production *** | 80,7% | 83,6% | 83,3% | ||||||
| % Protein | 3,38% | 3,32% | 3,40% | 3,34% | 3,36% | 3,46% | Jan-Mar 2024 | ||
| % Fat | 3,89% | 3,81% | 3,88% | 3,87% | 3,91% | 3,87% | Jan-Mar 2024 | ||
| Farm-gate milk prices (€ per 100 Kg) | 29,43 | 31,00 | 43,04 | 44,48 | 53,68 | 40,42 | -24,7% | Jan-Feb 2024 | |
| ± % Over the same period of the previous year | +5,3% | +38,8% | +3,3% | ||||||
| Organic milk production (goat, sheep, cow) | 3,2 | 6,3 | 6,5 | - | |||||
| Buffalo's - Goat's - Sheep's Milk | |||||||||
| Buffaloes ('000) | 7,5 | 7,8 | 8,7 | 7,6 | |||||
| Goats ('000) | 47 | 46 | 41 | 31 | |||||
| Goat's Milk Production (Cod.Eurostat D1130A) | 3,1 | 3,2 | 3,1 | - | |||||
| Sheeps ('000) | 944 | 887 | 872 | 907 | |||||
| Sheep's Milk Production (Cod.Eurostat D1120A) | 1,6 | 1,6 | 1,5 | - | |||||
| DAIRY PRODUCTION | 2020 | 2021 | 2022 | 2023 | 2023 | 2024 | % | Period | |
| Drinking milk (Cod. Eurostat D2100) | 557 | 522 | 538 | 521 | 131 | 135 | +3,5% | Jan-Mar 2024 | |
| Cream for direct consumption (Cod. Eurostat D2200V) | 9,9 | 10 | 11 | 12 | 3,5 | 2,7 | -21,8% | Jan-Mar 2024 | |
| Acidified milk (yoghurts and other) (Cod. Eurostat D4100) | 121 | 114 | 109 | 108 | 26 | 28 | +7,8% | Jan-Mar 2024 | |
| Butter (Cod. Eurostat D6000) | 9,2 | 9,2 | 9,3 | 8,5 | 2,4 | 3,3 | +39,2% | Jan-Mar 2024 | |
| Total Cheese (Cod. Eurostat D7100) | 94 | 96 | 93 | - | |||||
| I° Classificazione | |||||||||
| - Soft cheese ( Cod. Eurostat D7111) | 11 | 7,8 | 7,3 | - | |||||
| - Medium hard cheese ( Cod. Eurostat D7113) | 42 | 45 | 44 | - | |||||
| - Fresh cheese ( Cod. Eurostat D7116) | 37 | 40 | 37 | - | |||||
| 2° Classificazione | |||||||||
| - Cheese from cows'milk (pure) ( Cod. Eurostat D7121) | 94 | 95 | 92 | - | |||||
| Cheese from cows' milk (Cod. Eurostat D7121) | 94 | 95 | 92 | 85 | 22 | 23 | +6,1% | Jan-Mar 2024 | |
| Processed Cheese (Cod. Eurostat D7200) | 14 | 14 | 13 | - | |||||
| Drinks with a milk base (Cod. Eurostat D9100) | 45 | 45 | 33 | - | |||||
| Whey(Cod. Eurostat D5000) | 151 | 171 | 205 | - | |||||
| of which | |||||||||
| Whey liquid (Cod. Eurostat D5100) | 91 | 110 | 132 | - | |||||
| Whey concentrated (Cod. Eurostat D5200) | 40 | 51 | 51 | - | |||||
| Whey (in powder or in block) (Cod. Eurostat D5300) | 7,8 | 7,9 | 16 | - | |||||
| EXPORT | 2020 | 2021 | 2022 | 2023 | Jan | of which Extra EU | 2023 2024 % | 2023 2024 % | |
| Latte Sfuso (04011090+04012019+04012099) | TOP importers | 243 | 277 | 250 | 256 | 22 26 +20,7% | 2,8 2,7 -1,3% | ||
| Whole (04012099) | TOP importers | 230 | 266 | 238 | 245 | 21 26 +23,3% | 1,9 2,5 +34,4% | ||
| Semi-skimmed (04012019) | TOP importers | 0,3 | 0,1 | 2,0 | 2,0 | 0,1 0,1 +1,1% | 0,1 0,1 -0,6% | ||
| Skimmed (04011090) | TOP importers | 13 | 11 | 10 | 8,4 | 0,9 0,5 -40,6% | 0,8 0,1 -87,7% | ||
| Latte Confezionato (04011010+04012011+04012091) | TOP importers | 44 | 27 | 45 | 42 | 3,2 4,2 +31,0% | - - - | ||
| Whole (04012091) | TOP importers | 13 | 12 | 18 | 16 | 1,4 1,2 -12,6% | - - - | ||
| Semi-Skimmed (04012011) | TOP importers | 29 | 15 | 27 | 25 | 1,8 3,0 +65,0% | - - - | ||
| Skimmed (04011010) | TOP importers | 2,9 | 0,1 | 0,1 | 0,1 | 0,0 0,0 -48,9% | - - - | ||
| Cheese (0406) | TOP importers | 38 | 41 | 41 | 39 | 3,1 3,3 +6,3% | 1,4 1,3 -7,2% | ||
| Whey (0404) | TOP importers | 47 | 47 | 47 | 35 | 3,8 3,2 -16,9% | 1,4 0,4 -75,3% | ||
| Sweet dairy Whey (12% protein) and WPC (040410) | TOP importers | 18 | 17 | 20 | 15 | 1,3 1,0 -25,7% | 0,2 0,1 -55,9% | ||
| Cream (040130+040140+040150) | TOP importers | 6,6 | 12 | 13 | 14 | 0,9 1,0 +9,6% | 0,2 0,4 +71,2% | ||
| Yogurt and buttermilk (0403) | TOP importers | 12 | 9,7 | 11 | 9,9 | 0,8 0,8 +8,4% | - - - | ||
| Other Product | 12 | 11 | 11 | 13 | 1,1 0,7 -30,3% | 0,2 0,2 -1,9% | |||
| IMPORT | 2020 | 2021 | 2022 | 2023 | Jan | of which Extra EU | 2023 2024 % | 2023 2024 % | |
| Cheese (0406) | TOP exporters | 64 | 64 | 58 | 66 | 4,8 6,1 +25,3% | - - - | ||
| Yogurt and buttermilk (0403) | TOP exporters | 59 | 59 | 59 | 55 | 4,6 4,7 +2,6% | - - - | ||
| Latte Confezionato (04011010+04012011+04012091) | TOP exporters | 37 | 35 | 26 | 38 | 2,5 3,3 +34,5% | - - - | ||
| Whole (04012091) | TOP exporters | 7,2 | 7,3 | 7,1 | 9,2 | 0,6 0,8 +24,9% | - - - | ||
| Semi-Skimmed (04012011) | TOP exporters | 30 | 27 | 19 | 28 | 1,8 2,5 +37,1% | - - - | ||
| Skimmed (04011010) | TOP exporters | 0,3 | 0,2 | 0,3 | 0,1 | 0,0 0,0 +684,9% | - - - | ||
| Fat-Filled Milk Powder (FFMP) (190190) | TOP exporters | 34 | 35 | 36 | 35 | 2,9 3,2 +11,1% | - - - | ||
| Cream (040130+040140+040150) | TOP exporters | 16 | 16 | 13 | 12 | 0,8 1,0 +18,1% | - - - | ||
| SMP (040210) | TOP exporters | 7,4 | 9,2 | 10 | 10 | 0,9 1,0 +8,9% | - - - | ||
| Whey (0404) | TOP exporters | 6,9 | 6,2 | 7,2 | 7,5 | 0,7 0,8 +8,7% | - - - | ||
| Sweet dairy Whey (12% protein) and WPC (040410) | TOP exporters | 5,4 | 5,8 | 5,6 | 6,0 | 0,6 0,6 +8,8% | - - - | ||
| Butter And Other Fats (0405) | TOP exporters | 6,9 | 6,7 | 6,3 | 6,9 | 0,5 0,6 +5,1% | - - - | ||
| Anhydrous Milk Fat (040590) | TOP exporters | 0,1 | 0,1 | 0,1 | 0,0 | 0,0 0,0 -74,9% | - - - | ||
| Whey Protein Isolate (WPI) (350220) | TOP exporters | 5,3 | 5,3 | 4,3 | 5,0 | 0,2 0,4 +152,1% | - - - | ||
| Latte Sfuso (04011090+04012019+04012099) | TOP exporters | 8,5 | 3,9 | 14 | 4,1 | 0,5 0,3 -46,9% | - - - | ||
| Whole (04012099) | TOP exporters | 7,7 | 2,6 | 11 | 2,4 | 0,1 0,3 +74,9% | - - - | ||
| Semi-skimmed (04012019) | TOP exporters | 0,3 | 0,7 | 1,3 | 0,0 | 0,0 0,0 -96,6% | - - - | ||
| Skimmed (04011090) | TOP exporters | 0,5 | 0,6 | 1,5 | 1,6 | 0,4 0,0 -93,3% | - - - | ||
| Other Product | 10 | 11 | 11 | 11 | 1,0 0,8 -16,7% | - - - | |||
| Soya-based beverages (protein content >=2,8 %) | 2,3 | 1,6 | 1,3 | 2,3 | 0,1 0,4 +153,2% | - - - | |||
| Soya-based beverages (protein content of <2.8%) based on nuts, cereals or seeds | 20 | 27 | 25 | 30 | 2,9 2,7 -8,1% | - - - | |||
| Non-alcoholic beverages containing < 0,2% fats derived from milk or milk products | 0,1 | 0,1 | 0,5 | 0,7 | 0,0 0,0 -1,2% | - - - | |||
| % Self-sufficiency rate | 93,45% | 95,61% | 96,66% | 94,19% | 92,76% | Jan 2024 | |||
| SOCIO-ECONOMIC INDICATORS | 2020 | 2021 | 2022 | 2023 | 2023 | 2024(f) | % | Period | |
| GDP (gross domestic product) | -4,70% | 7,04% | 4,57% | -0,66% | -0,66% | 2,70% | Jan-Dic 2024 | ||
| CPI (consumer price index) | 3,34% | 5,10% | 14,75% | 17,09% | 17,09% | 4,30% | Jan-Dic 2024 | ||
| Population ('000) | 9.770 | 9.731 | 9.689 | 9.600 | |||||
| GDP per capita (U.S. dollars) | 16.094 | 18.732 | 18.579 (e) | 21.076 (e) | |||||
| GDP per capita (€) * | 14.081 | 15.838 | 17.643(e) | 19.491(e) | |||||
Informative Note
(c): confidential data, missing months
(c): confidential data, missing months
(c): confidential data, missing months
(f): forecast
(e) estimated
* Per capita GDP in Euro is calculated by using the yearly average exchange rate
SOURCES
Raw material area: Sheep and Goat Milk Deliveries: Eurostat (annual data dataset: apro_mk_pobta); Milk Deliveries, % Protein e % Fat: Eurostat (dataset: apro_mk_colm); Milk Production: Eurostat (dataset: agr_r_milkpr); Number of cows: Eurostat (dataset: agr_r_animal); Number of Goats, Sheeps and Bufaloes: Eurostat (dataset: apro_mt_lsgoat, apro_mt_lssheep, apro_mt_lscatl ); Sheep and Goat Milk Production: Eurostat (annual data dataset: apro_mk_farm); Farm-gate milk prices: Hungarian Central Statistical Office (KSH) ; Import/Export of Breeding Heifers: IHS ; Organic Milk Production: Eurostat (dataset: org_aprod);
Dairy production: (annual data dataset: apro_mk_pobta, monthly data dataset: apro_mk_colm)
Export: Eurostat
Import: Eurostat
GDP and CPI: Intesa Sanpaolo
GDP per capita: International Monetary Found
Population: Eurostat
*** MILK DELIVERIES AND MILK PRODUCTION
Note: Self-sufficiency rate = Milk deliveries/(Domestic use in milk equivalent ME)
Domestic use in milk equivalent (ME) = Milk deliveries + Import in ME - Export in ME
The Self-sufficiency rate does not consider the trade of FFMP (fat-filled milk powder) - HS 190190 and the infant milk formula.
Last update: 03-05-2024
(c): confidential data, missing months
(c): confidential data, missing months
(f): forecast
(e) estimated
* Per capita GDP in Euro is calculated by using the yearly average exchange rate
SOURCES
Raw material area: Sheep and Goat Milk Deliveries: Eurostat (annual data dataset: apro_mk_pobta); Milk Deliveries, % Protein e % Fat: Eurostat (dataset: apro_mk_colm); Milk Production: Eurostat (dataset: agr_r_milkpr); Number of cows: Eurostat (dataset: agr_r_animal); Number of Goats, Sheeps and Bufaloes: Eurostat (dataset: apro_mt_lsgoat, apro_mt_lssheep, apro_mt_lscatl ); Sheep and Goat Milk Production: Eurostat (annual data dataset: apro_mk_farm); Farm-gate milk prices: Hungarian Central Statistical Office (KSH) ; Import/Export of Breeding Heifers: IHS ; Organic Milk Production: Eurostat (dataset: org_aprod);
Dairy production: (annual data dataset: apro_mk_pobta, monthly data dataset: apro_mk_colm)
Export: Eurostat
Import: Eurostat
GDP and CPI: Intesa Sanpaolo
GDP per capita: International Monetary Found
Population: Eurostat
*** MILK DELIVERIES AND MILK PRODUCTION
- Milk deliveries (apro_mk_colm): milk collected by dairies (located in the Member State) from the agricultural holdings (within or outside the Member State).
- Milk production (agr_r_milkpr): milk produced by agricultural holdings (located in the Member State) and a part of this milk is delivered to dairies (within or outside the Member State).
Note: Self-sufficiency rate = Milk deliveries/(Domestic use in milk equivalent ME)
Domestic use in milk equivalent (ME) = Milk deliveries + Import in ME - Export in ME
The Self-sufficiency rate does not consider the trade of FFMP (fat-filled milk powder) - HS 190190 and the infant milk formula.
Last update: 03-05-2024
NOTA: Access to Dairy World Trade,
which also contains the processing of Import / Export of the Hungary with MONTHLY UPDATES,
is reserved for Supporters of CLAL.it