


.jpg)


.jpg)


Performance of Dairy Farms FARM S/STEM |
||
|
Goal of the FARM S/STEM project is to assess the competitiveness
of Italian dairy Farms. CLAL selected a group of dairy farmers
of Northern Italy having a special interest in performance analysis and costs and sent out its Team to assess the herd
management on these Farms and to collect dairy farm data. Show/Hide chart explanation
Each coloured area is representative of a Farm; the vertexes on the various axes indicate the results for each
Farm in terms of: productivity, fat and protein content, the success in shortening the age at first calving,
replacement capacity and number of lactations per cow; all important items for Farm performance analysis. 


|
||
|
|
Farms may be compared based on milk destination, be it for the production of: |
|
|
* The Replacement Capacity consists in the number of heifers in the Dairy farm between 10 and 22 months of age divided by the total number of culled animals in a year. In the study sample there are Farms with a high replacement capacity. These are Farms which are expanding and/or which depend for a considerable part of their returns on the sale of heifers. View Farm returns in the FARM S/STEM project » |
||
Your dairy FarmBy filling in the form below you can visualize the graph of your dairy Farm (red coloured area, identified by the code TU__) and compare its performance with those of the dairy Farms participating in the FARM S/STEM project. The processing takes place on your computer: no data is sent to CLAL. The numbers to be entered are the yearly averages for each item. |
||
FARM S/STEM Performance
Minimum, average and maximum performance of dairy Farms participating in the project.
Israel 2011: 24.4 months |
||
|
For any questions or comments please write to |
||
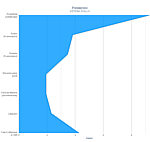 below the chart at the centre of the page the graph expands, allowing a more detailed study of the data. In this mode,
the zoom function can be activated by simply selecting a specific area with the mouse.
below the chart at the centre of the page the graph expands, allowing a more detailed study of the data. In this mode,
the zoom function can be activated by simply selecting a specific area with the mouse.
Due to extraordinary maintenance, some site features may be temporarily unavailable. Thank you for your understanding.