This page provides with:
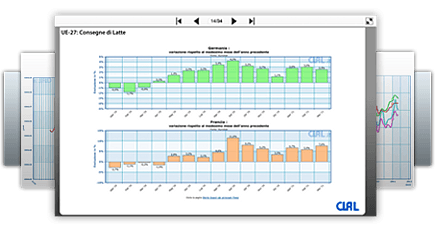
- two graphs representing the share (%) of production in the given period for the main dairy products compared to the same period of the previous year.
The first graph shows data referring both to the EU-27 and some important international Players, while the second graph illustrates French, Germany, the Netherlands, Poland and Italy data;
- a summary table showing the same data (in volumes) mentioned above, up to dates on a monthly basis.
|
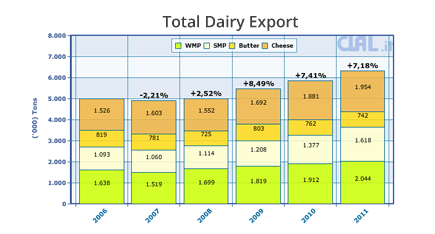
| DAIRY PRODUCTS OUTPUT |
| Product |
Gathering period |
Ton |
± on
one year ago |
| ITALY |
| Milk deliveries |
January - February - 2024 |
2.231.525
|

|
+2,49%
|
|
|
| Liquid Milk |
January - March - 2024 |
646.110
|

|
-4,94%
|
|
|
| Butter |
January - March - 2024 |
26.400
|
|
|
+2,44%
|
|
|
| Milk Cream |
January - March - 2024 |
39.900
|
|
|
+2,36%
|
|
|
| Cheeses |
January - March - 2024 |
300.660
|
|
|
+0,44%
|
|
|
| EUROPE |
| Milk deliveries |
January - March - 2024 |
35.039.722
|
|
|
+0,90%*
|
|
|
| Butter |
January - March - 2024 |
531.266
|
|
|
-3,60%*
|
|
|
| Cheeses |
January - March - 2024 |
2.419.568
|
|
|
+2,59%*
|
|
|
| SMP |
January - March - 2024 |
348.657
|
|
|
+1,34%*
|
|
|
| WMP |
January - March - 2024 |
180.537
|
|
|
+0,07%*
|
|
|
| ANALYSIS: France, Germany, The Netherlands and Poland |
| FRANCE |
| Milk deliveries |
January - March - 2024 |
6.184.410
|
|
|
+1,61%
|
|
|
| Butter |
January - March - 2024 |
108.890
|
|
|
-4,62%
|
|
|
| Cheeses |
January - March - 2024 |
440.240
|
|
|
+1,04%
|
|
|
| SMP |
January - March - 2024 |
99.400
|
|
|
+0,67%
|
|
|
| WMP |
January - March - 2024 |
30.040
|
|
|
-2,69%
|
|
|
| GERMANY |
| Milk deliveries |
January - March - 2024 |
8.191.020
|
|
|
+0,41%
|
|
|
| Butter |
January - March - 2024 |
133.316
|

|
0,00%
|
|
|
| Cheeses |
January - March - 2024 |
608.528
|
|
|
0,00%
|
|
|
| SMP |
January - March - 2024 |
98.777
|
|
|
0,00%
|
|
|
| WMP |
January - March - 2024 |
76.087
|
|
|
0,00%
|
|
|
| THE NETHERLANDS |
| Milk deliveries |
January - March - 2024 |
3.512.582
|
|
|
-1,10%
|
|
|
| Butter |
January - March - 2024 |
31.600
|
|
|
-5,39%
|
|
|
| Cheeses |
January - March - 2024 |
239.000
|
|
|
+0,46%
|
|
|
| SMP |
January - March - 2024 |
22.800
|
|
|
-5,79%
|
|
|
| WMP |
January - March - 2024 |
21.400
|
|
|
+5,42%
|
|
|
| POLAND |
| Milk deliveries |
January - March - 2024 |
3.303.947
|
|
|
+2,20%
|
|
|
| Butter |
January - March - 2024 |
67.840
|
|
|
-4,38%
|
|
|
| Cheeses |
January - March - 2024 |
267.010
|
|
|
+9,89%
|
|
|
| SMP |
January - March - 2024 |
44.200
|
|
|
+9,43%
|
|
|
| WMP |
January - March - 2024 |
6.710
|
|
|
-9,81%
|
|
|
| WORLD |
| USA |
| Milk deliveries |
January - March - 2024 |
25.803.320
|
|
|
+0,09%
|
|
|
| Butter |
January - March - 2024 |
282.788
|
|
|
+4,46%
|
|
|
| Cheeses |
January - March - 2024 |
1.617.974
|
|
|
+0,09%
|
|
|
| SMP + NDM |
January - March - 2024 |
267.869
|
|
|
-16,20%
|
|
|
| WMP |
January - March - 2024 |
28.435
|
|
|
+2,76%
|
|
|
| AUSTRALIA |
| Milk deliveries |
January - March - 2024 |
1.867.915
|
|
|
+5,51%
|
|
|
| Butter |
January - December - 2023 |
34.419
|
|
|
-3,91%
|
|
|
| Butteroil |
January - December - 2023 |
8.348
|
|
|
-12,72%
|
|
|
| Cheeses |
January - December - 2023 |
374.728
|
|
|
-2,51%
|
|
|
| SMP |
January - December - 2023 |
143.405
|
|
|
+4,51%
|
|
|
| WMP |
January - December - 2023 |
29.519
|
|
|
-19,59%
|
|
|
|
|
|
* Percentage change is based on the same period of previous year, according to the most recent update of each Member State.
|
|
|


.jpg)


.jpg)


 enter
enter
 enter
enter
 enter
enter
 subscribe