


.jpg)


.jpg)


EU-27: Yogurt production
This page contains the European Acidified milk (yoghurts and other) production data, both in tables and charts.
The table offers as well the possibility to:
- consult the monthly volumes and changes, by clicking on the years in the column headers,
- access to the DairySheets by clicking on the names of the Member States of the EU.
The charts display:
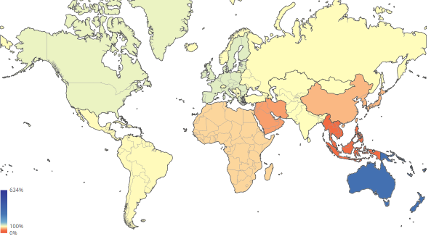
- a breakdown of the Acidified milk (yoghurts and other) production by Member States
- the monthly and average daily Acidified milk (yoghurts and other) production,
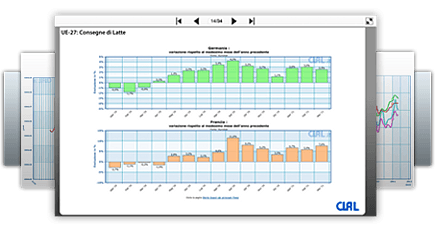
- the year-over-year changes of Acidified milk (yoghurts and other) production in the major EU Players,
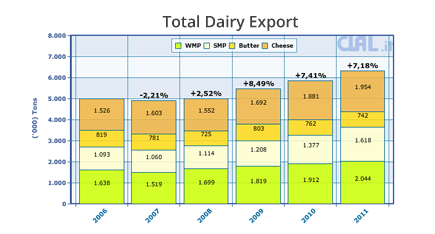
- the yearly Acidified milk (yoghurts and other) production of the last seven years,
- the Acidified milk (yoghurts and other) production with rolling year
| UE-27: Production of Acidified milk (yoghurts and other) (Tons) | ||||||||||||||
| COUNTRY | 2018 | 2019 | 2020 | 2021 | 2022 | 2023 | 2023 | 2024 | Var % | Period | ||||
| Austria | 261.600 | 262.700 | 256.280 | 258.890 | 271.540 | 264.360 | 65.160 | 67.510 | +3,6% | Jan - Mar '24 | ||||
| Belgium | 309.090 | 305.790 | 322.960 | 336.630 | 319.940 | 318.560 | 85.690 | 87.420 | +2,0% | Jan - Mar '24 | ||||
| Bulgaria | 161.160 | 170.160 | 169.390 | 170.650 | 163.630 | 161.070 | 38.420 | 38.460 | +0,1% | Jan - Mar '24 | ||||
| Croatia | 92.910 | 92.540 | 88.810 | 89.250 | 86.890 | 89.230 | 20.270 | 21.460 | +5,9% | Jan - Mar '24 | ||||
| Cyprus | 5.710 | 5.840 | 4.730 | 4.870 | 6.720 | 7.990 | 1.850 | 2.080 | +12,4% | Jan - Mar '24 | ||||
| Czech Republic | 177.820 | 182.890 | 187.680 | 181.740 | 182.020 | 180.610 | 46.620 | 46.370 | -0,5% | Jan - Mar '24 | ||||
| Denmark | 120.100 | 114.500 | 124.800 | 120.700 | 123.800 | 125.200 | 30.500 | 29.400 | -3,6% | Jan - Mar '24 | ||||
| Estonia | 39.500 | 39.200 | 39.800 | 40.700 | 38.400 | 35.900 | 8.900 | 8.600 | -3,4% | Jan - Mar '24 | ||||
| Finland | 169.760 | 166.290 | 168.230 | 163.420 | 160.020 | 157.950 | 40.140 | 38.900 | -3,1% | Jan - Mar '24 | ||||
| France | 1.453.600 | 1.370.430 | 1.415.140 | 1.346.720 | 1.336.300 | 1.343.800 | 342.860 | 347.280 | +1,3% | Jan - Mar '24 | ||||
| Germany | 1.879.200 | 1.856.470 | 1.823.570 | 1.750.530 | 1.690.630 | 1.695.480 | 425.270 | 444.760 | +4,6% | Jan - Mar '24 | ||||
| Greece | 130.400 | 141.200 | 154.640 | 168.020 | 177.850 | 179.860 | 43.000 | 42.260 | -1,7% | Jan - Mar '24 | ||||
| Hungary | 121.930 | 119.490 | 121.420 | 114.340 | 109.280 | 107.950 | 25.710 | 27.720 | +7,8% | Jan - Mar '24 | ||||
| Ireland | 0 | 0 | 0 | 0 | 0 | 0 | 0 | 0 | - | Jan - Mar '24 | ||||
| Italy | 278.500 | 266.440 | 273.970 | 284.160 | 286.940 | 283.280 | 73.110 | 67.890 | -7,1% | Jan - Mar '24 | ||||
| Latvia | 37.620 | 37.520 | 38.000 | 36.020 | 28.320 | 36.250 | 8.240 | 8.740 | +6,1% | Jan - Mar '24 | ||||
| Lithuania | 76.470 | 74.690 | 74.960 | 75.050 | 72.040 | 72.690 | 16.320 | 17.130 | +5,0% | Jan - Mar '24 | ||||
| Luxembourg | (c) | (c) | (c) | (c) | (c) | (c) | (c) | (c) | - | Jan - Mar '24 | ||||
| Malta | (c) | (c) | (c) | (c) | (c) | (c) | (c) | (c) | - | Jan - Apr '24 | ||||
| Netherlands | 309.500 | 290.700 | 328.900 | 283.800 | 286.000 | 274.900 | 69.800 | 69.700 | -0,1% | Jan - Mar '24 | ||||
| Poland | 531.910 | 537.100 | 538.100 | 547.730 | 570.830 | 600.160 | 143.920 | 154.460 | +7,3% | Jan - Mar '24 | ||||
| Portugal | 118.000 | 115.970 | 117.480 | 117.620 | 125.160 | 125.610 | 30.490 | 30.200 | -1,0% | Jan - Mar '24 | ||||
| Romania | 215.230 | 225.490 | 225.700 | 220.420 | 212.600 | 202.770 | 51.220 | 54.430 | +6,3% | Jan - Mar '24 | ||||
| Slovakia | 65.730 | 58.140 | 52.250 | 47.130 | 46.590 | 50.070 | 12.090 | 13.550 | +12,1% | Jan - Mar '24 | ||||
| Slovenia | 43.760 | 45.030 | 46.200 | 45.930 | 46.340 | 49.790 | 11.390 | 12.990 | +14,0% | Jan - Mar '24 | ||||
| Spain | 1.011.810 | 980.950 | 926.420 | 937.280 | 981.670 | 1.098.140 | 250.990 | 276.740 (e) | +10,3% | Jan - Mar '24 | ||||
| Sweden | 228.750 | 223.650 | 236.000 | 229.640 | 224.780 | 223.650 | 53.790 | 55.890 | +3,9% | Jan - Mar '24 | ||||
| TOTAL EU-27 | 7.840.060 | 7.683.180 | 7.735.430 | 7.571.240 | 7.548.290 | 7.685.270 | 1.895.750 | 1.963.940 (e) | +3,6% | Jan - Mar '24 | ||||
| y-o-y % | -2,0% | +0,7% | -2,1% | -0,3% | +1,8% | |||||||||
|
(e) estimated data (c) confidential data NOTE:The countries highlighted in yellow indicate the presence of some confidential data which are not considered in the total calculation of productions. Source: Eurostat, ISTAT, Stimato CLAL |
||||||||||||||
Rolling year: for each month the chart visualizes the production in that month plus the production of the previous 11 months. With this method is always considered the total production in a time window of 12 months, so it is possible to identify the trend without the effect of seasonality.