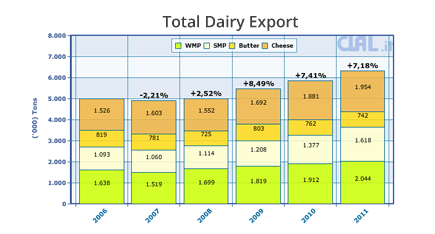
< >

Spain: Monthly deliveries of Goat’s Milk for Autonomous Communities

This page contains the data relating to the deliveries of Goat's Milk for Autonomous Communities in Spain, in particular:
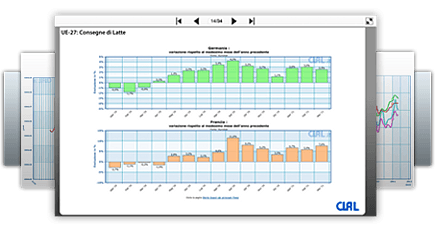
  • two graphs that display the data of Spanish milk deliveries, and deliveries changes, on a monthly basis and in a three-year perspective;
  • a table which records the data of monthly Goat's milk deliveries in the Spanish Autonomous Communities, for the current calendar year;
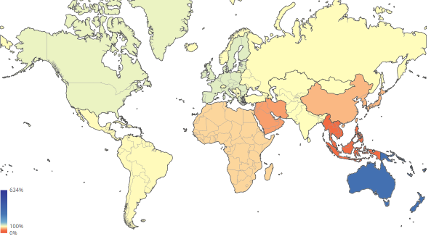
  • a pie chart representing the deliveries share of the Autonomous Communities.
It is possible to view the Goat's Milk deliveries data of the Autonomous Communities starting from 2016

Visit the pages:
Spain: Deliveries of Goat's Milk (000 liter)
Autonomous Communities 2016 2017 2018 2019 2020 2021 2022 2023 2023 2024 % Change Period
Andalusia 163.694 176.164 177.795 174.800 175.048 180.525 170.346 161.572 38.549 41.045 +6.47% Jan - Mar '24
Aragon 798 809 649 802 684 623 1.067 1.269 260 299 +14.89% Jan - Mar '24
Asturias 432 423 210 183 87 94 112 150 32 17 -47.98% Jan - Mar '24
Cantabria 264 286 297 278 305 361 405 389 76 76 +0.32% Jan - Mar '24
Castile and Leon 35.979 40.616 42.602 44.752 47.958 50.990 51.742 49.849 11.425 11.647 +1.94% Jan - Mar '24
Castile - La Mancha 85.598 85.635 76.684 75.483 64.315 61.424 48.323 45.219 9.809 11.447 +16.70% Jan - Mar '24
Canary Islands 23.642 25.584 26.463 27.520 30.467 29.311 27.580 27.548 6.453 6.576 +1.91% Jan - Mar '24
Catalonia 4.948 5.424 5.973 6.614 6.812 7.705 6.986 7.057 1.436 1.469 +2.28% Jan - Mar '24
Extremadura 29.069 25.951 27.898 29.340 30.718 31.450 29.595 29.097 6.952 7.206 +3.65% Jan - Mar '24
Galicia 20.188 20.664 19.479 15.761 15.677 13.167 12.258 11.786 2.840 2.891 +1.78% Jan - Mar '24
Murcia 59.202 61.134 64.470 68.939 68.080 67.728 63.931 65.579 15.527 15.652 +0.80% Jan - Mar '24
Madrid 15.490 15.330 14.761 12.159 12.098 11.515 10.347 10.069 2.328 2.715 +16.64% Jan - Mar '24
Navarre 657 744 781 790 413 415 890 3.270 1.541 693 -55.02% Jan - Mar '24
Basque country 0 10 40 43 48 44 59 44 10 7 -34.71% Jan - Mar '24
La Rioja 1.363 1.337 1.371 1.148 1.552 1.738 1.678 1.529 310 356 +14.74% Jan - Mar '24
Valencia 17.954 18.723 18.027 15.845 14.567 13.527 12.215 9.224 2.198 2.092 -4.82% Jan - Mar '24
Total Spain 459.291 478.848 477.516 474.504 468.887 470.670 437.554 423.651 99.746 104.190 +4.46% Jan - Mar '24
Change % on previous year +4.26% -0.28% -0.63% -1.18% +0.38% -7.04% -3.18%

* YOY Change
Source: FEGA