


.jpg)


.jpg)
Poland: Dairy sector
This Country:
- accounts for 9,0% of EU milk deliveries (year 2023),
- exports dairy products, converted into milk equivalent (ME), for the 36,5% of the milk deliveries (year 2022),
- accounts for 5,8% of EU dairy exports in ME (year 2023).
The orange links allow a further analysis on TESEO.
![]()
![]()
![]()
![]()
Latest climate weekly reports about precipitations and temperatures.
Total Precipitation: level of rainfall;
Temperature anomalies: variation compared to historical mean temperature;
Min Temperature: minimum temperature;
Max Temperature: maximum temperature;
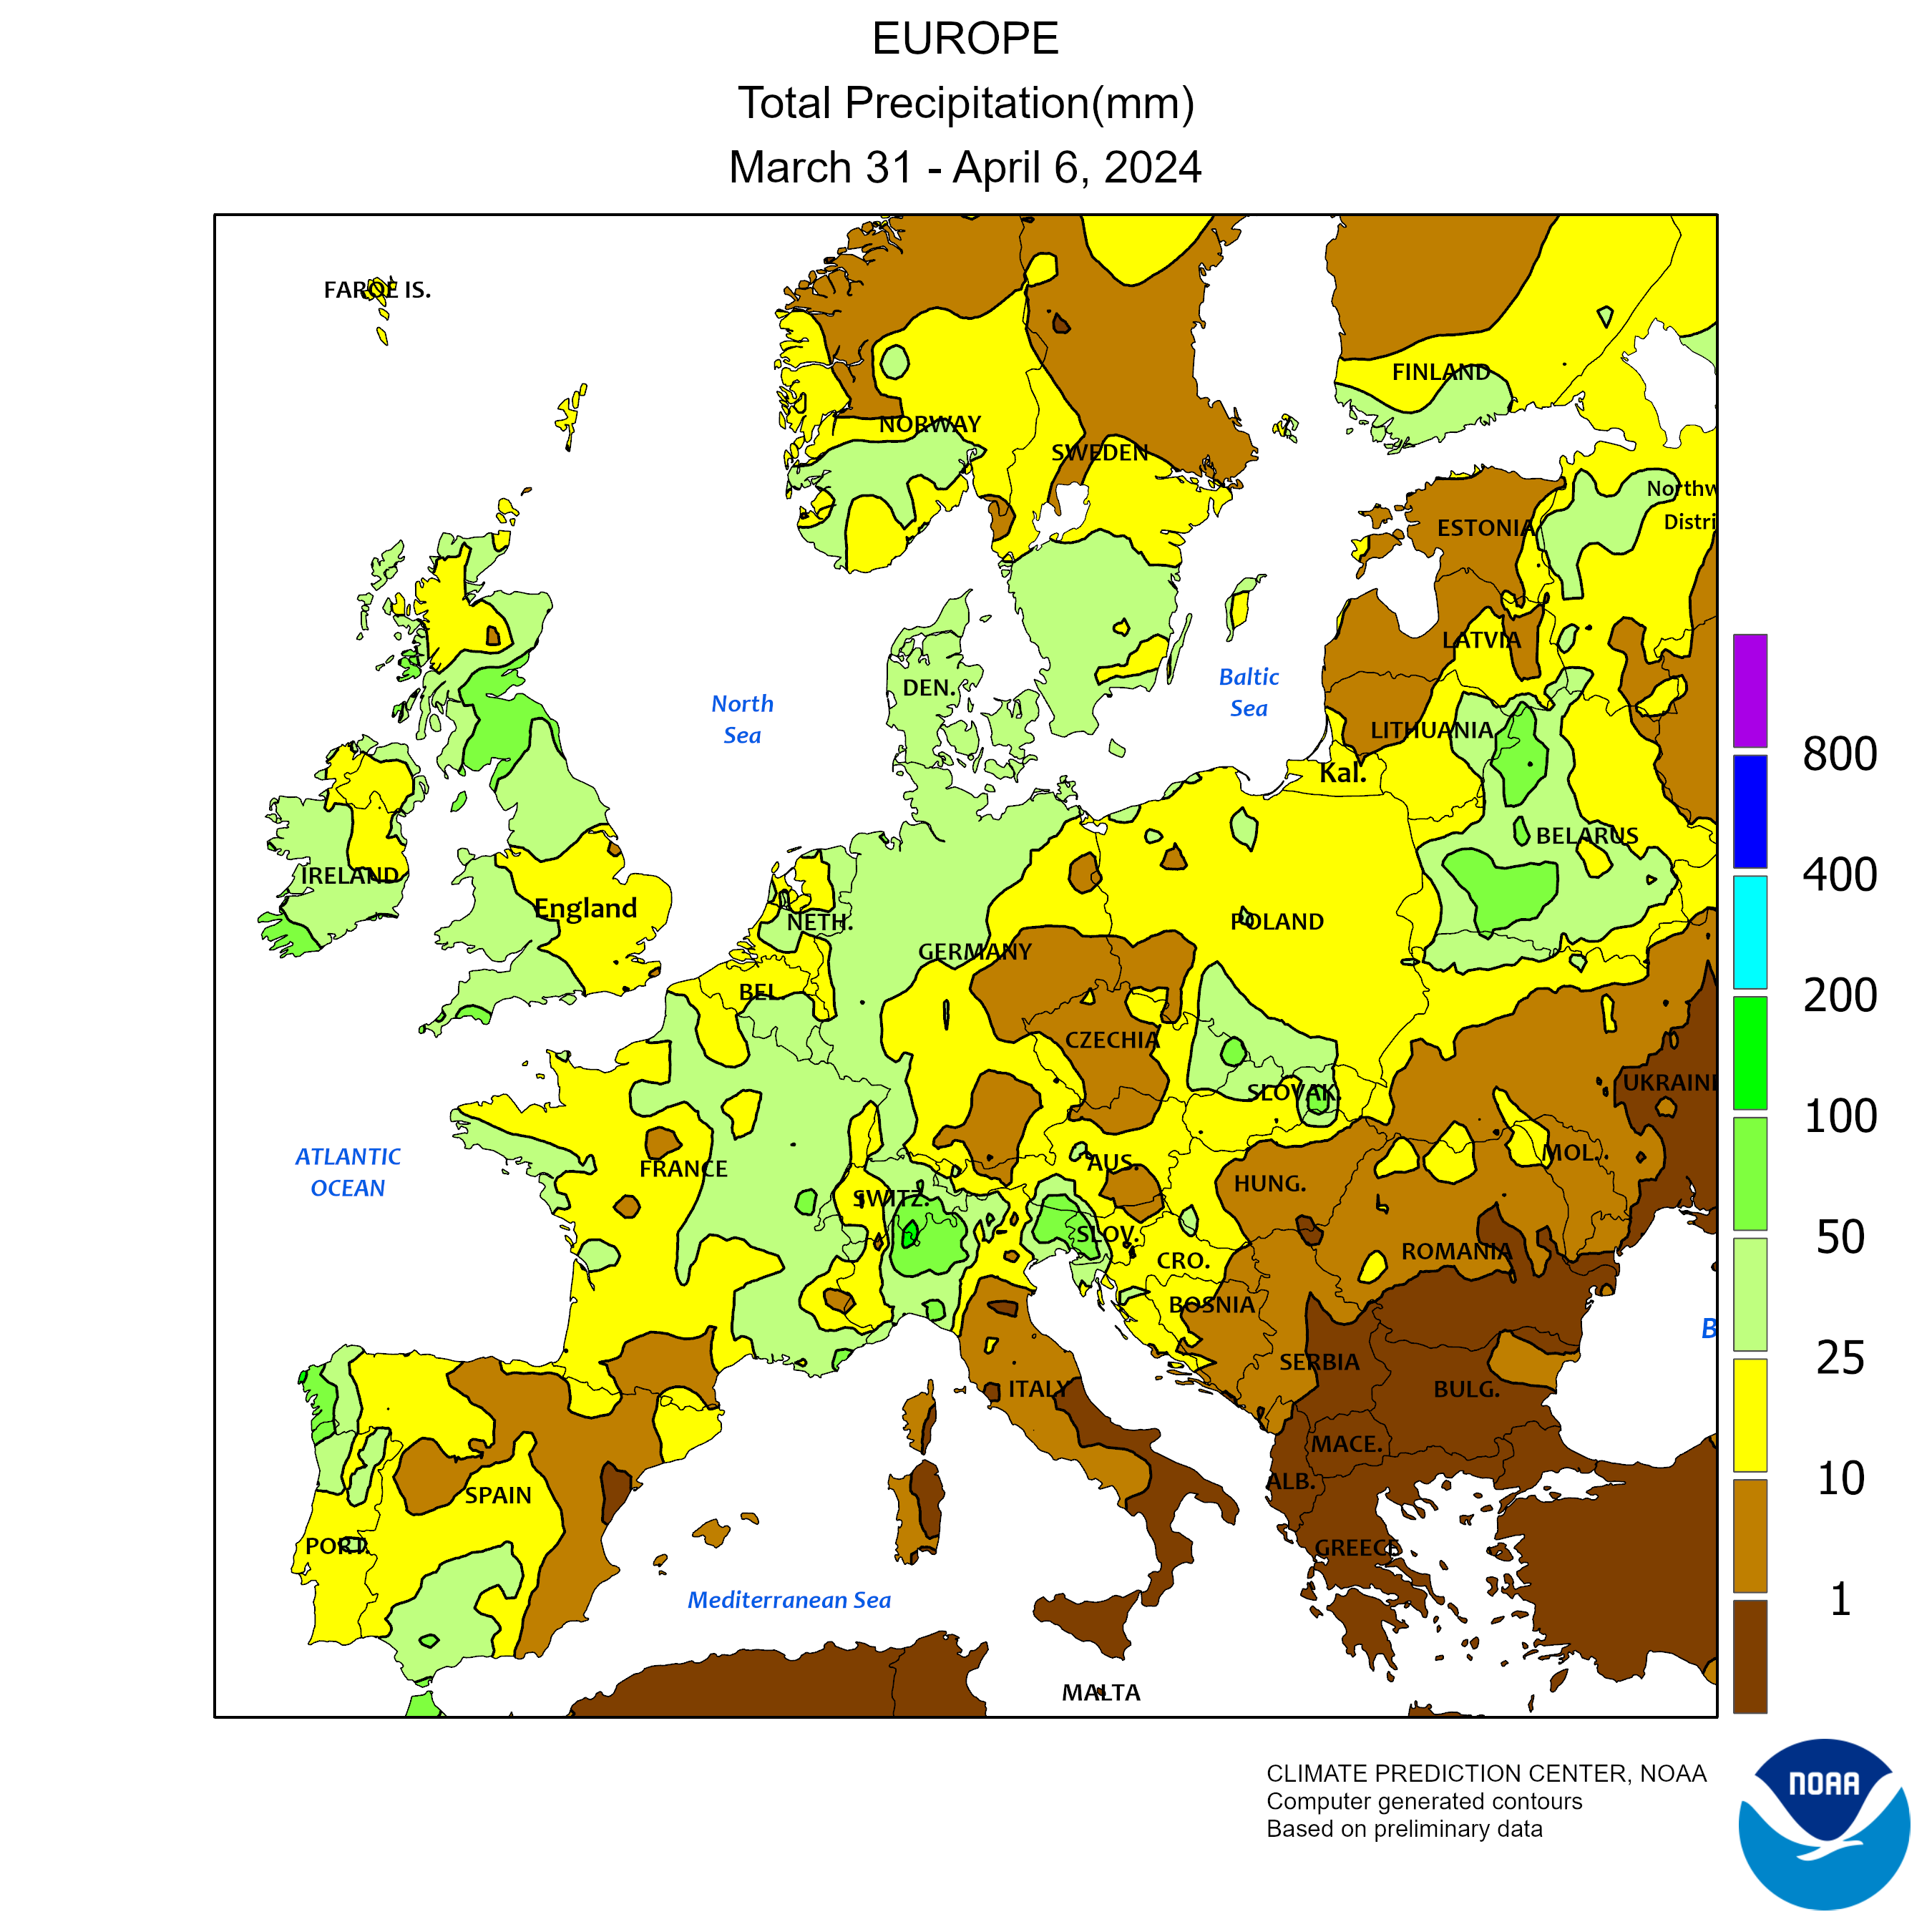
Total Precipitation
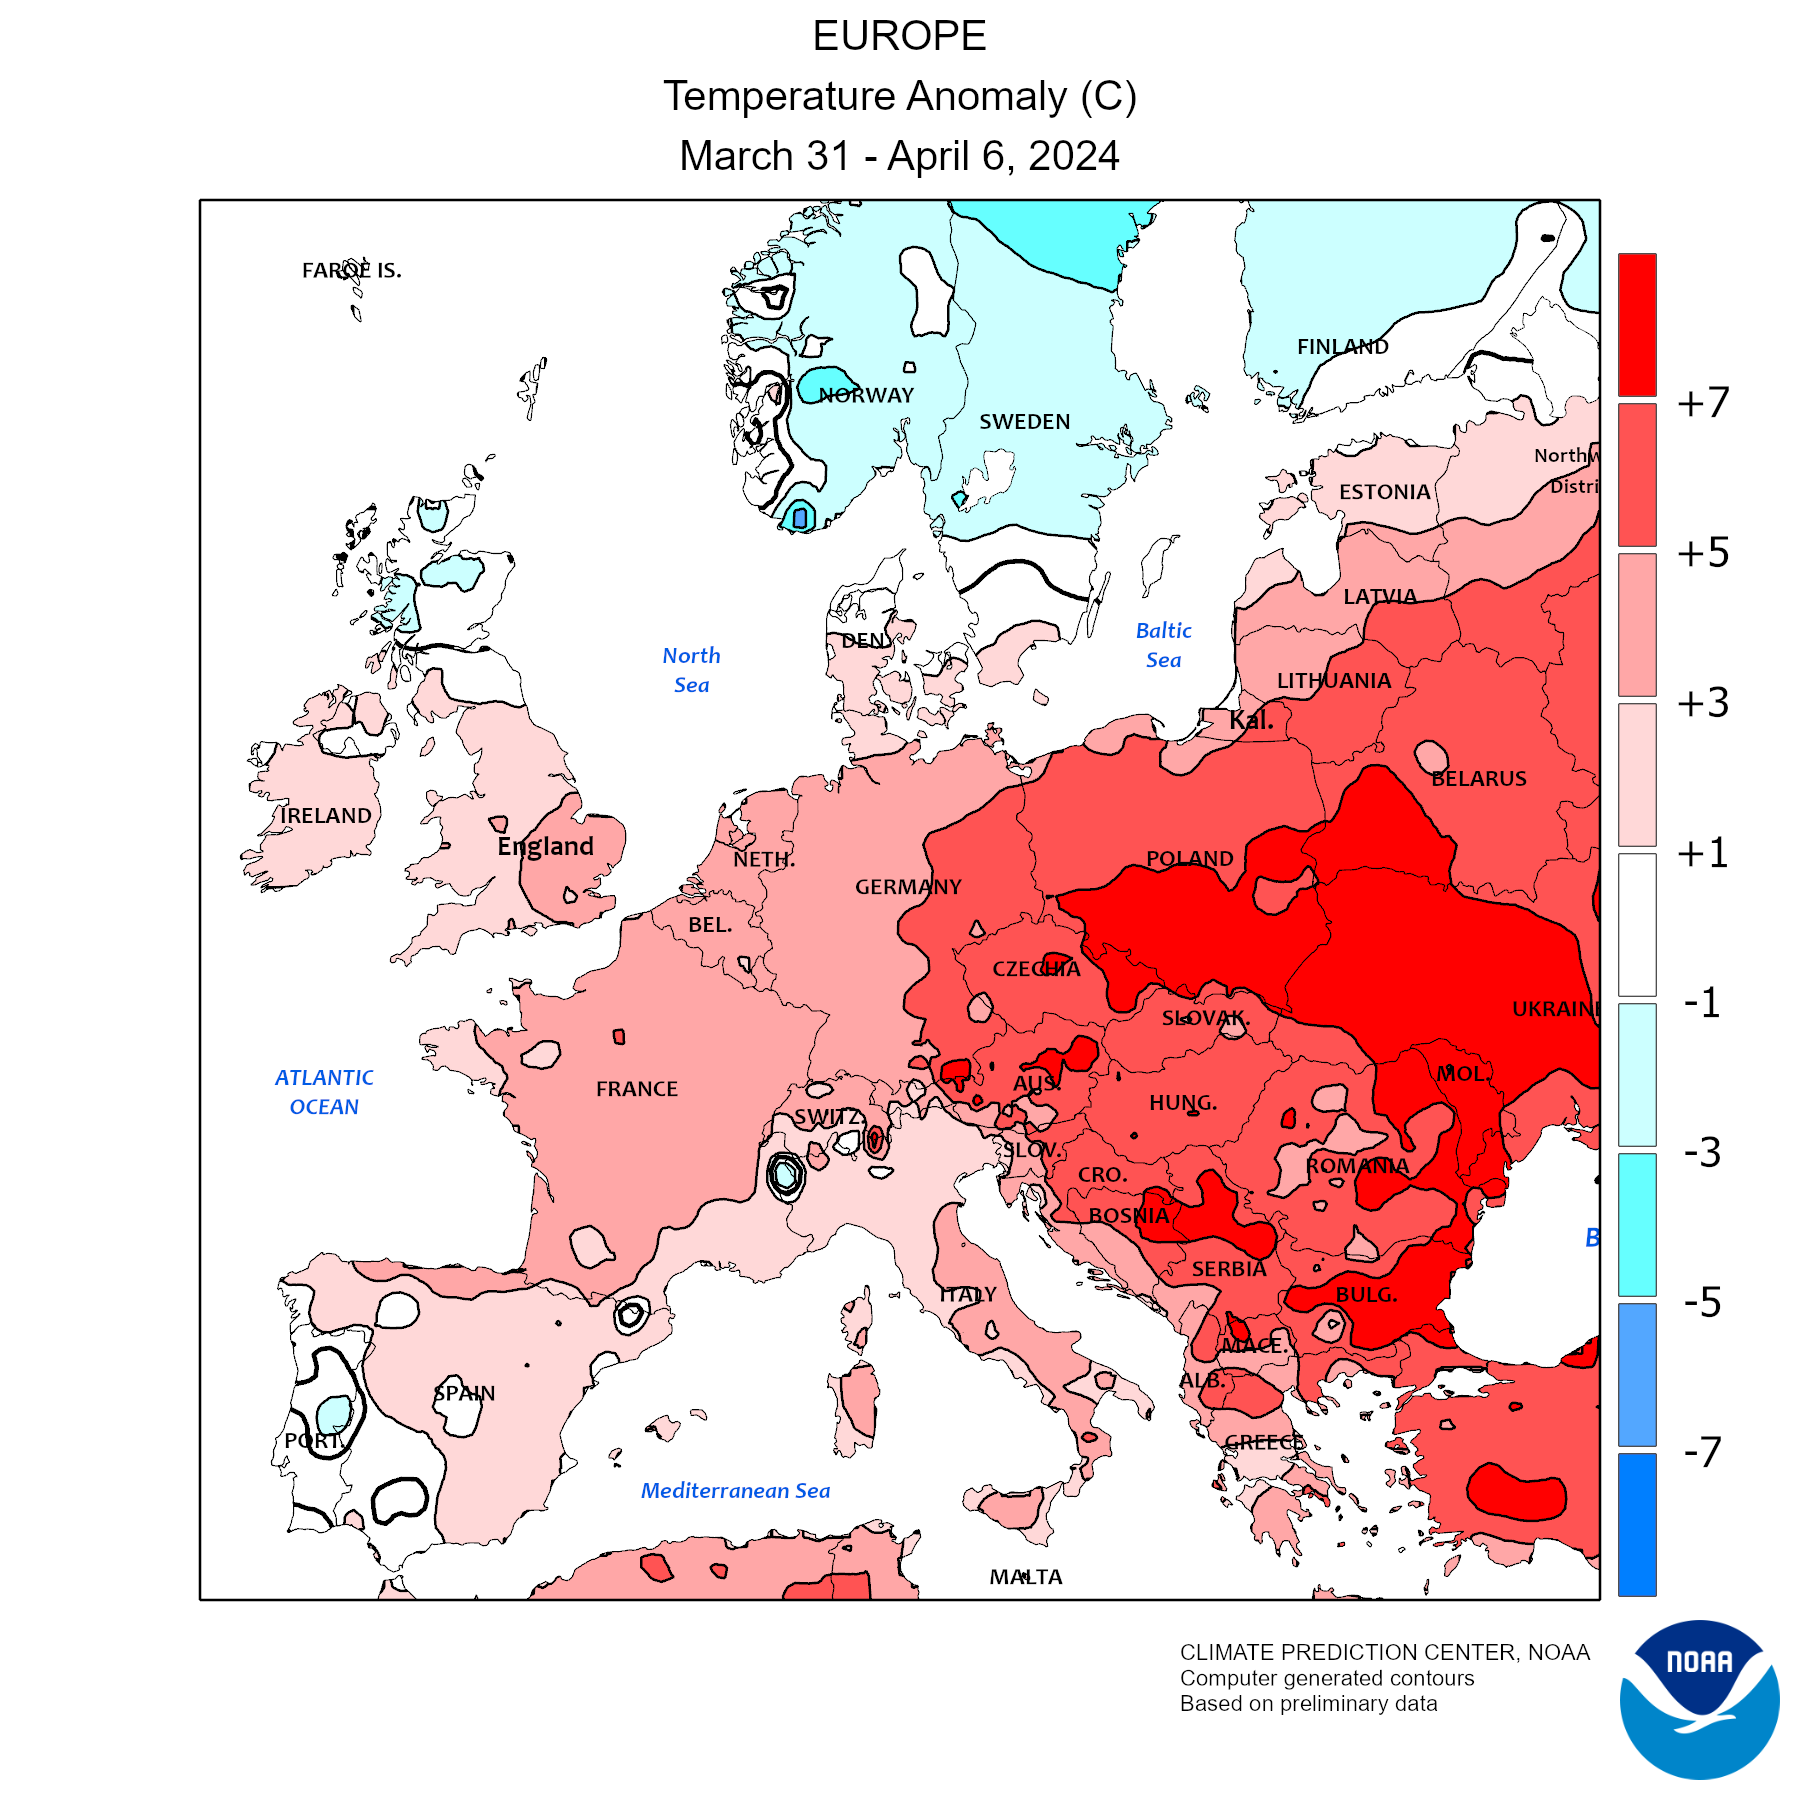
Temperature anomalies
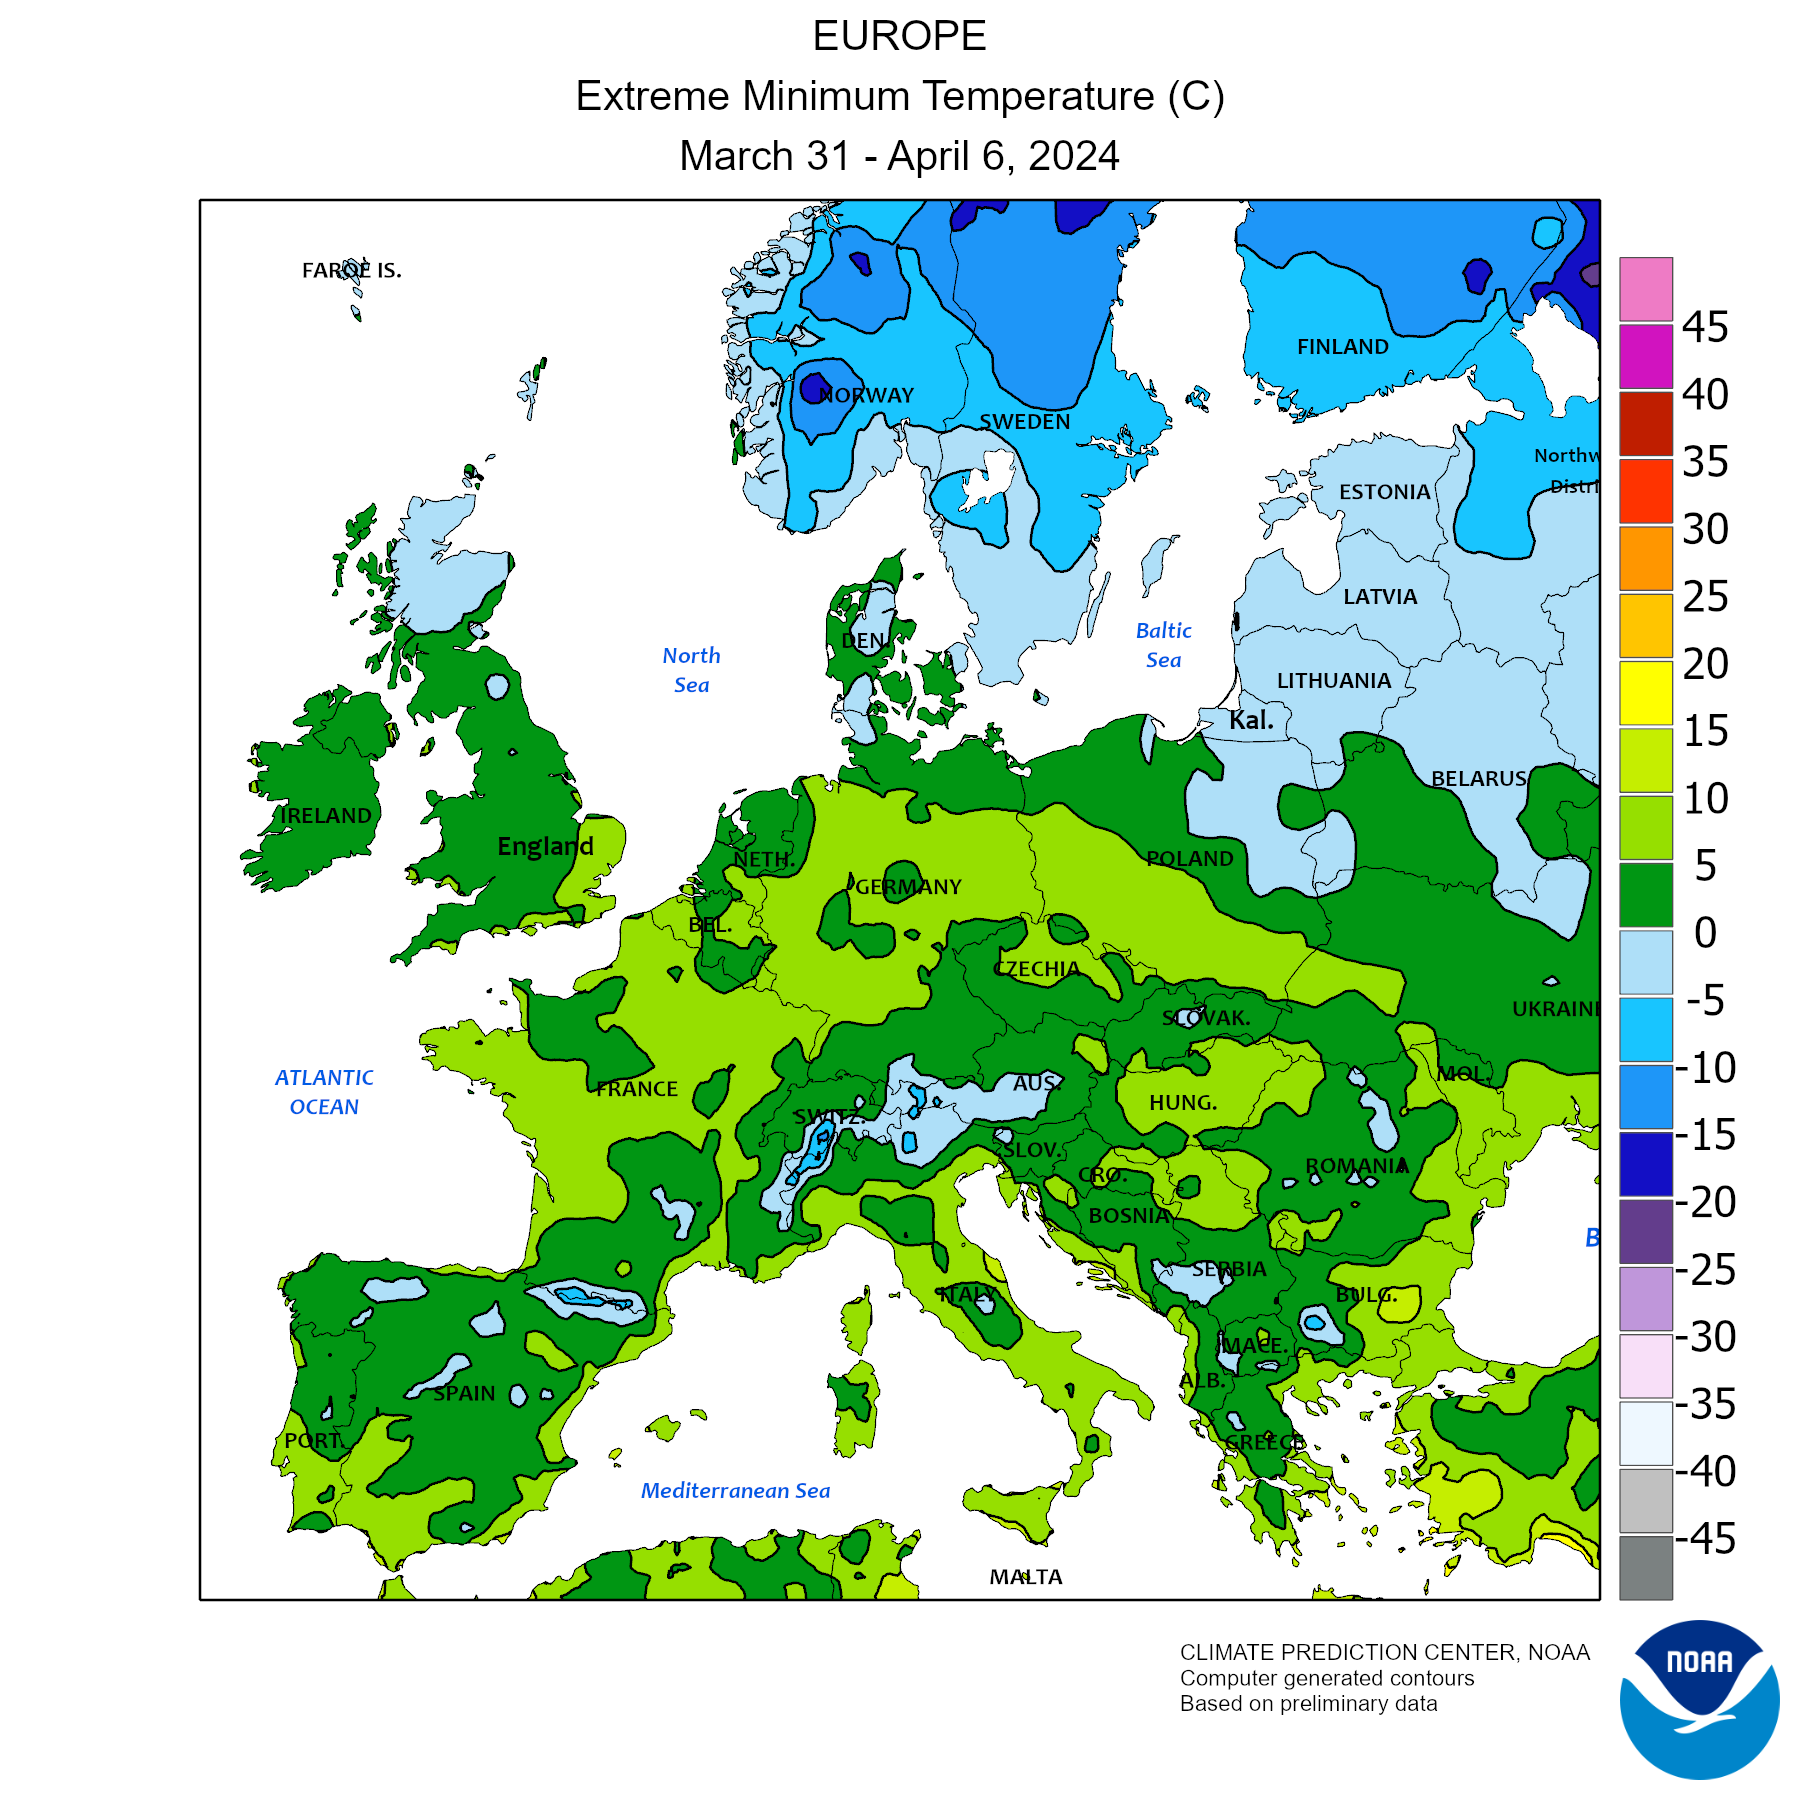
Min Temperature

Max Temperature
×
×
×
×
| POLAND: DAIRY SECTOR | |||||||||
| x 1.000 ton | |||||||||
| RAW MATERIAL AREA | 2020 | 2021 | 2022 | 2023 | 2023 | 2024 | % | Period | |
| Cow's Milk | |||||||||
| Dairy Farm Structure | |||||||||
| Live bovine animals ('000 Head) | 6.279 | 6.379 | 6.448 | 6.436 | |||||
| of which | |||||||||
| Cows ('000 Head) | 2.126 | 2.035 | 2.037 | 2.069 | |||||
| Slaughtered cows ('000 head) | 531 | 554 | 546 | 511 | 40 | 58 | +43,9% | Jan 2024 | |
| Export of Breeding Heifers (HS 01022110 - head) | 7.973 | 12.277 | 15.765 | 15.733 | 1.061 | 548 | -48,4% | Jan 2024 | |
| Import of Breeding Heifers (HS 01022110 - head) | 7.336 | 6.871 | 4.418 | 2.124 | 208 | 37 | -82,2% | Jan 2024 | |
| Milk production | 14.503 | 14.881 | 15.208 | ||||||
| ± % Over the same period of the previous year | +2,6% | +2,2% | |||||||
| Raw cows' milk delivered to dairies (Cod. Eurostat D1110D) | 12.446 | 12.493 | 12.771 | 12.976 | 2.105 | 2.182 | +3,7% | Jan-Feb 2024 | |
| ± % Over the same period of the previous year | +0,4% | +2,2% | +1,6% | ||||||
| % Delivery on production *** | 85,8% | 84,0% | 84,0% | ||||||
| % Protein | 3,31% | 3,33% | 3,36% | 3,37% | 3,39% | 3,44% | Jan-Feb 2024 | ||
| % Fat | 4,05% | 4,10% | 4,08% | 4,08% | 4,15% | 4,18% | Jan-Feb 2024 | ||
| Farm-gate milk prices (€ per 100 Kg) | 31,56 | 34,47 | 49,08 | 45,75 | 49,82 | 47,64 | -4,4% | Jan-Feb 2024 | |
| ± % Over the same period of the previous year | +9,2% | +42,4% | -6,8% | ||||||
| Goat's - Sheep's Milk | |||||||||
| Goats ('000) | - | - | 63 | - | |||||
| Goat's Milk Production (Cod.Eurostat D1130A) | 8,5 | 8,7 | 9,2 | - | |||||
| Sheeps ('000) | - | - | 266 | - | |||||
| Sheep's Milk Production (Cod.Eurostat D1120A) | 0,5 | 0,5 | 0,4 | - | |||||
| DAIRY PRODUCTION | 2020 | 2021 | 2022 | 2023 | 2023 | 2024 | % | Period | |
| Drinking milk (Cod. Eurostat D2100) | 1.987 | 1.958 | 1.978 | 1.920 | 310 | 325 | +4,9% | Jan-Feb 2024 | |
| Cream for direct consumption (Cod. Eurostat D2200V) | 259 | 260 | 266 | 262 | 36 | 38 | +6,0% | Jan-Feb 2024 | |
| Acidified milk (yoghurts and other) (Cod. Eurostat D4100) | 538 | 548 | 571 | 600 | 93 | 99 | +7,4% | Jan-Feb 2024 | |
| Butter (Cod. Eurostat D6000) | 243 | 231 | 243 | 264 | 46 | 45 | -1,9% | Jan-Feb 2024 | |
| Rendered butter and butteroil (Cod.Eurostat D6200) | 4,8 | 6,0 | 6,2 | - | |||||
| Other Yellow Fat Dairy Products (Cod. Eurostat D6900) | 16 | 16 | 16 | - | |||||
| Total Cheese (Cod. Eurostat D7100) | 894 | 920 | 926 | - | |||||
| I° Classificazione | |||||||||
| - Soft cheese ( Cod. Eurostat D7111) | 29 | 30 | 29 | - | |||||
| - Medium hard cheese ( Cod. Eurostat D7113) | 193 | 218 | 221 | - | |||||
| - Hard cheese ( Cod. Eurostat D7114) | 164 | 150 | 158 | - | |||||
| - Fresh cheese ( Cod. Eurostat D7116) | 476 | 487 | 493 | - | |||||
| 2° Classificazione | |||||||||
| - Cheese from cows'milk (pure) ( Cod. Eurostat D7121) | 893 | 919 | 925 | - | |||||
| Cheese from cows' milk (Cod. Eurostat D7121) | 909 | 942 | 945 | 1.001 | 156 | 175 | +12,0% | Jan-Feb 2024 | |
| Processed Cheese (Cod. Eurostat D7200) | 51 | 52 | 52 | - | |||||
| Concentrated milk (Cod. Eurostat D3200) | 33 | 32 | 30 | 29 | 4,1 | 5,1 | +23,4% | Jan-Feb 2024 | |
| Milk and cream powders (excl. SMP)WMP - (c) (Cod. Eurostat D3100_X_3113) | 30 | 31 | 30 | 23 | 2,7 | 1,9 | -27,3% | Jan 2024 | |
| SMP - Skimmed milk powder (SMP) (Cod. Eurostat D3113) | 165 | 153 | 151 | 159 | 26 | 29 | +11,7% | Jan-Feb 2024 | |
| Drinks with a milk base (Cod. Eurostat D9100) | 83 | 89 | 84 | - | |||||
| Whey(Cod. Eurostat D5000) | 7.437 | 6.916 | 6.867 | - | |||||
| of which | |||||||||
| Whey liquid (Cod. Eurostat D5100) | 559 | 552 | 549 | - | |||||
| Whey concentrated (Cod. Eurostat D5200) | 535 | 677 | 579 | - | |||||
| Whey (in powder or in block) (Cod. Eurostat D5300) | 309 | 324 | 316 | - | |||||
| Other fresh products (milk-based desserts, ice cream) (Cod. Eurostat D9200) | 28 | 30 | 27 | - | |||||
| EXPORT | 2020 | 2021 | 2022 | 2023 | Jan | of which Extra EU | 2023 2024 % | 2023 2024 % | |
| Latte Sfuso (04011090+04012019+04012099) | TOP importers | 466 | 446 | 435 | 460 | 36 38 +3,4% | - - - | ||
| Whole (04012099) | TOP importers | 419 | 415 | 426 | 446 | 36 37 +2,7% | - - - | ||
| Semi-skimmed (04012019) | TOP importers | 12 | 4,2 | 1,6 | 2,2 | 0,0 0,1 +77,6% | - - - | ||
| Skimmed (04011090) | TOP importers | 35 | 27 | 7,3 | 12 | 0,4 0,6 +53,8% | - - - | ||
| Latte Confezionato (04011010+04012011+04012091) | TOP importers | 302 | 337 | 306 | 305 | 22 24 +7,5% | 13 14 +10,2% | ||
| Whole (04012091) | TOP importers | 240 | 283 | 250 | 246 | 17 19 +12,5% | 11 12 +16,0% | ||
| Semi-Skimmed (04012011) | TOP importers | 54 | 49 | 52 | 55 | 5,3 4,7 -10,4% | 2,1 1,6 -22,6% | ||
| Skimmed (04011010) | TOP importers | 9,1 | 5,5 | 4,2 | 3,0 | 0,2 0,3 +74,1% | 0,1 0,1 +146,4% | ||
| Cheese (0406) | TOP importers | 263 | 288 | 280 | 282 | 21 22 +2,5% | 6,2 6,4 +3,9% | ||
| Whey (0404) | TOP importers | 225 | 233 | 222 | 214 | 19 16 -16,0% | 11 9,2 -16,5% | ||
| Sweet dairy Whey (12% protein) and WPC (040410) | TOP importers | 210 | 214 | 204 | 201 | 18 15 -15,9% | 10 8,9 -13,1% | ||
| Fat-Filled Milk Powder (FFMP) (190190) | TOP importers | 161 | 154 | 169 | 188 | 15 19 +25,0% | 8,2 11 +36,5% | ||
| Yogurt and buttermilk (0403) | TOP importers | 108 | 116 | 131 | 133 | 11 11 -0,2% | 2,9 2,9 +3,0% | ||
| SMP (040210) | TOP importers | 110 | 109 | 119 | 129 | 9,7 11 +11,2% | 6,7 8,5 +26,9% | ||
| Butter And Other Fats (0405) | TOP importers | 57 | 49 | 74 | 74 | 7,7 5,5 -28,1% | 0,8 0,9 +13,1% | ||
| Anhydrous Milk Fat (040590) | TOP importers | 1,7 | 2,4 | 2,0 | 2,3 | 0,1 0,1 +16,2% | - - - | ||
| Cream (040130+040140+040150) | TOP importers | 70 | 95 | 101 | 71 | 3,1 5,3 +71,1% | 0,4 0,5 +9,2% | ||
| Infant milk formula (190110) | TOP importers | 53 | 50 | 54 | 57 | 4,3 4,8 +9,7% | 2,2 2,9 +31,7% | ||
| Other Product | 90 | 79 | 79 | 81 | 6,4 8,3 +30,7% | 2,7 4,3 +60,7% | |||
| IMPORT | 2020 | 2021 | 2022 | 2023 | Jan | of which Extra EU | 2023 2024 % | 2023 2024 % | |
| Cheese (0406) | TOP exporters | 98 | 109 | 107 | 118 | 8,1 10 +24,9% | 0,1 0,1 -0,1% | ||
| Latte Sfuso (04011090+04012019+04012099) | TOP exporters | 118 | 132 | 126 | 107 | 6,5 5,1 -22,0% | - - - | ||
| Whole (04012099) | TOP exporters | 71 | 83 | 75 | 65 | 3,8 3,6 -4,0% | - - - | ||
| Semi-skimmed (04012019) | TOP exporters | 9,9 | 8,2 | 13 | 10 | 0,4 0,1 -79,2% | - - - | ||
| Skimmed (04011090) | TOP exporters | 37 | 41 | 38 | 32 | 2,4 1,4 -42,1% | - - - | ||
| Whey (0404) | TOP exporters | 100 | 131 | 105 | 94 | 6,1 7,1 +16,2% | 0,0 0,3 0,0% | ||
| Sweet dairy Whey (12% protein) and WPC (040410) | TOP exporters | 68 | 94 | 76 | 66 | 4,2 4,5 +5,7% | 0,0 0,2 0,0% | ||
| Cream (040130+040140+040150) | TOP exporters | 57 | 66 | 71 | 85 | 7,7 5,3 -31,4% | - - - | ||
| Fat-Filled Milk Powder (FFMP) (190190) | TOP exporters | 70 | 64 | 73 | 75 | 6,3 6,1 -4,0% | - - - | ||
| SMP (040210) | TOP exporters | 49 | 53 | 72 | 66 | 4,2 4,7 +12,9% | 0,2 0,1 -28,7% | ||
| Yogurt and buttermilk (0403) | TOP exporters | 59 | 61 | 60 | 58 | 5,1 5,1 +1,1% | - - - | ||
| Condensed Milk (040291+040299) | TOP exporters | 51 | 47 | 34 | 50 | 4,3 4,7 +9,7% | - - - | ||
| Infant milk formula (190110) | TOP exporters | 29 | 36 | 44 | 40 | 3,8 3,9 +3,5% | - - - | ||
| Butter And Other Fats (0405) | TOP exporters | 20 | 31 | 27 | 22 | 1,1 1,6 +41,2% | - - - | ||
| Anhydrous Milk Fat (040590) | TOP exporters | 5,9 | 12 | 7,4 | 6,9 | 0,5 0,7 +55,3% | - - - | ||
| WMP (040221+040229) | TOP exporters | 17 | 19 | 18 | 20 | 1,5 1,7 +13,3% | - - - | ||
| Lactose Pharmaceutical (170211) | TOP exporters | 12 | 12 | 14 | 15 | 0,9 1,3 +40,6% | - - - | ||
| Other Product | 29 | 35 | 37 | 38 | 2,8 2,4 -15,1% | 0,6 0,6 +5,1% | |||
| Soya-based beverages (protein content >=2,8 %) | 14 | 15 | 13 | 12 | 0,5 0,7 +34,8% | - - - | |||
| Soya-based beverages (protein content of <2.8%) based on nuts, cereals or seeds | 23 | 28 | 28 | 34 | 1,7 3,2 +91,4% | - - - | |||
| Non-alcoholic beverages containing < 0,2% fats derived from milk or milk products | 6,1 | 6,9 | 10 | 13 | 1,1 1,0 -11,8% | - - - | |||
| % Self-sufficiency rate | 128,5% | 128,5% | 125,2% | 126,1% | 124,0% | Jan 2024 | |||
| SOCIO-ECONOMIC INDICATORS | 2020 | 2021 | 2022 | 2023 | 2023 | 2024(f) | % | Period | |
| GDP (gross domestic product) | -2,03% | 6,84% | 5,51% | 0,38% | 0,38% | 3,20% | Jan-Dic 2024 | ||
| CPI (consumer price index) | 3,38% | 5,13% | 14,36% | 11,44% | 11,44% | 4,60% | Jan-Dic 2024 | ||
| Population ('000) | 37.958 | 37.840 | 37.654 | 36.754 | |||||
| GDP per capita (U.S. dollars) | 15.793 | 18.008 | 18.343 (e) | 22.393 (e) | |||||
| GDP per capita (€) * | 13.817 | 15.226 | 17.419(e) | 20.710(e) | |||||
Informative Note
(c): confidential data, missing months
(f): forecast
(e) estimated
* Per capita GDP in Euro is calculated by using the yearly average exchange rate
SOURCES
Raw material area: Sheep and Goat Milk Deliveries: Eurostat (annual data dataset: apro_mk_pobta); Milk Deliveries, % Protein e % Fat: Eurostat (dataset: apro_mk_colm); Milk Production: Eurostat (dataset: agr_r_milkpr); Number of cows: Eurostat (dataset: agr_r_animal); Number of Goats, Sheeps and Bufaloes: Eurostat (dataset: apro_mt_lsgoat, apro_mt_lssheep, apro_mt_lscatl ); Sheep and Goat Milk Production: Eurostat (annual data dataset: apro_mk_farm); Farm-gate milk prices: Ministerstwo Rolnictwa i Rozwoju Wsi, Departament Wspólnej Organizacji Rynków Rolnych ; Import/Export of Breeding Heifers: IHS ; Organic Milk Production: Eurostat (dataset: org_aprod);
Dairy production: (annual data dataset: apro_mk_pobta, monthly data dataset: apro_mk_colm)
Export: Eurostat
Import: Eurostat
GDP and CPI: Intesa Sanpaolo
GDP per capita: International Monetary Found
Population: Eurostat
*** MILK DELIVERIES AND MILK PRODUCTION
Note: Self-sufficiency rate = Milk deliveries/(Domestic use in milk equivalent ME)
Domestic use in milk equivalent (ME) = Milk deliveries + Import in ME - Export in ME
The Self-sufficiency rate does not consider the trade of FFMP (fat-filled milk powder) - HS 190190 and the infant milk formula.
Last update: 19-04-2024
(f): forecast
(e) estimated
* Per capita GDP in Euro is calculated by using the yearly average exchange rate
SOURCES
Raw material area: Sheep and Goat Milk Deliveries: Eurostat (annual data dataset: apro_mk_pobta); Milk Deliveries, % Protein e % Fat: Eurostat (dataset: apro_mk_colm); Milk Production: Eurostat (dataset: agr_r_milkpr); Number of cows: Eurostat (dataset: agr_r_animal); Number of Goats, Sheeps and Bufaloes: Eurostat (dataset: apro_mt_lsgoat, apro_mt_lssheep, apro_mt_lscatl ); Sheep and Goat Milk Production: Eurostat (annual data dataset: apro_mk_farm); Farm-gate milk prices: Ministerstwo Rolnictwa i Rozwoju Wsi, Departament Wspólnej Organizacji Rynków Rolnych ; Import/Export of Breeding Heifers: IHS ; Organic Milk Production: Eurostat (dataset: org_aprod);
Dairy production: (annual data dataset: apro_mk_pobta, monthly data dataset: apro_mk_colm)
Export: Eurostat
Import: Eurostat
GDP and CPI: Intesa Sanpaolo
GDP per capita: International Monetary Found
Population: Eurostat
*** MILK DELIVERIES AND MILK PRODUCTION
- Milk deliveries (apro_mk_colm): milk collected by dairies (located in the Member State) from the agricultural holdings (within or outside the Member State).
- Milk production (agr_r_milkpr): milk produced by agricultural holdings (located in the Member State) and a part of this milk is delivered to dairies (within or outside the Member State).
Note: Self-sufficiency rate = Milk deliveries/(Domestic use in milk equivalent ME)
Domestic use in milk equivalent (ME) = Milk deliveries + Import in ME - Export in ME
The Self-sufficiency rate does not consider the trade of FFMP (fat-filled milk powder) - HS 190190 and the infant milk formula.
Last update: 19-04-2024
NOTA: Access to Dairy World Trade,
which also contains the processing of Import / Export of the Poland with MONTHLY UPDATES,
is reserved for Supporters of CLAL.it