


.jpg)


.jpg)


Germany: Dairy sector
This Country:
- accounts for 22,4% of EU milk deliveries (year 2023),
- exports dairy products, converted into milk equivalent (ME), for the 55,6% of the milk deliveries (year 2022),
- accounts for 22,6% of EU dairy exports in ME (year 2023).
The orange links allow a further analysis on TESEO.
![]()
![]()
![]()
![]()
Latest climate weekly reports about precipitations and temperatures.
Total Precipitation: level of rainfall;
Temperature anomalies: variation compared to historical mean temperature;
Min Temperature: minimum temperature;
Max Temperature: maximum temperature;
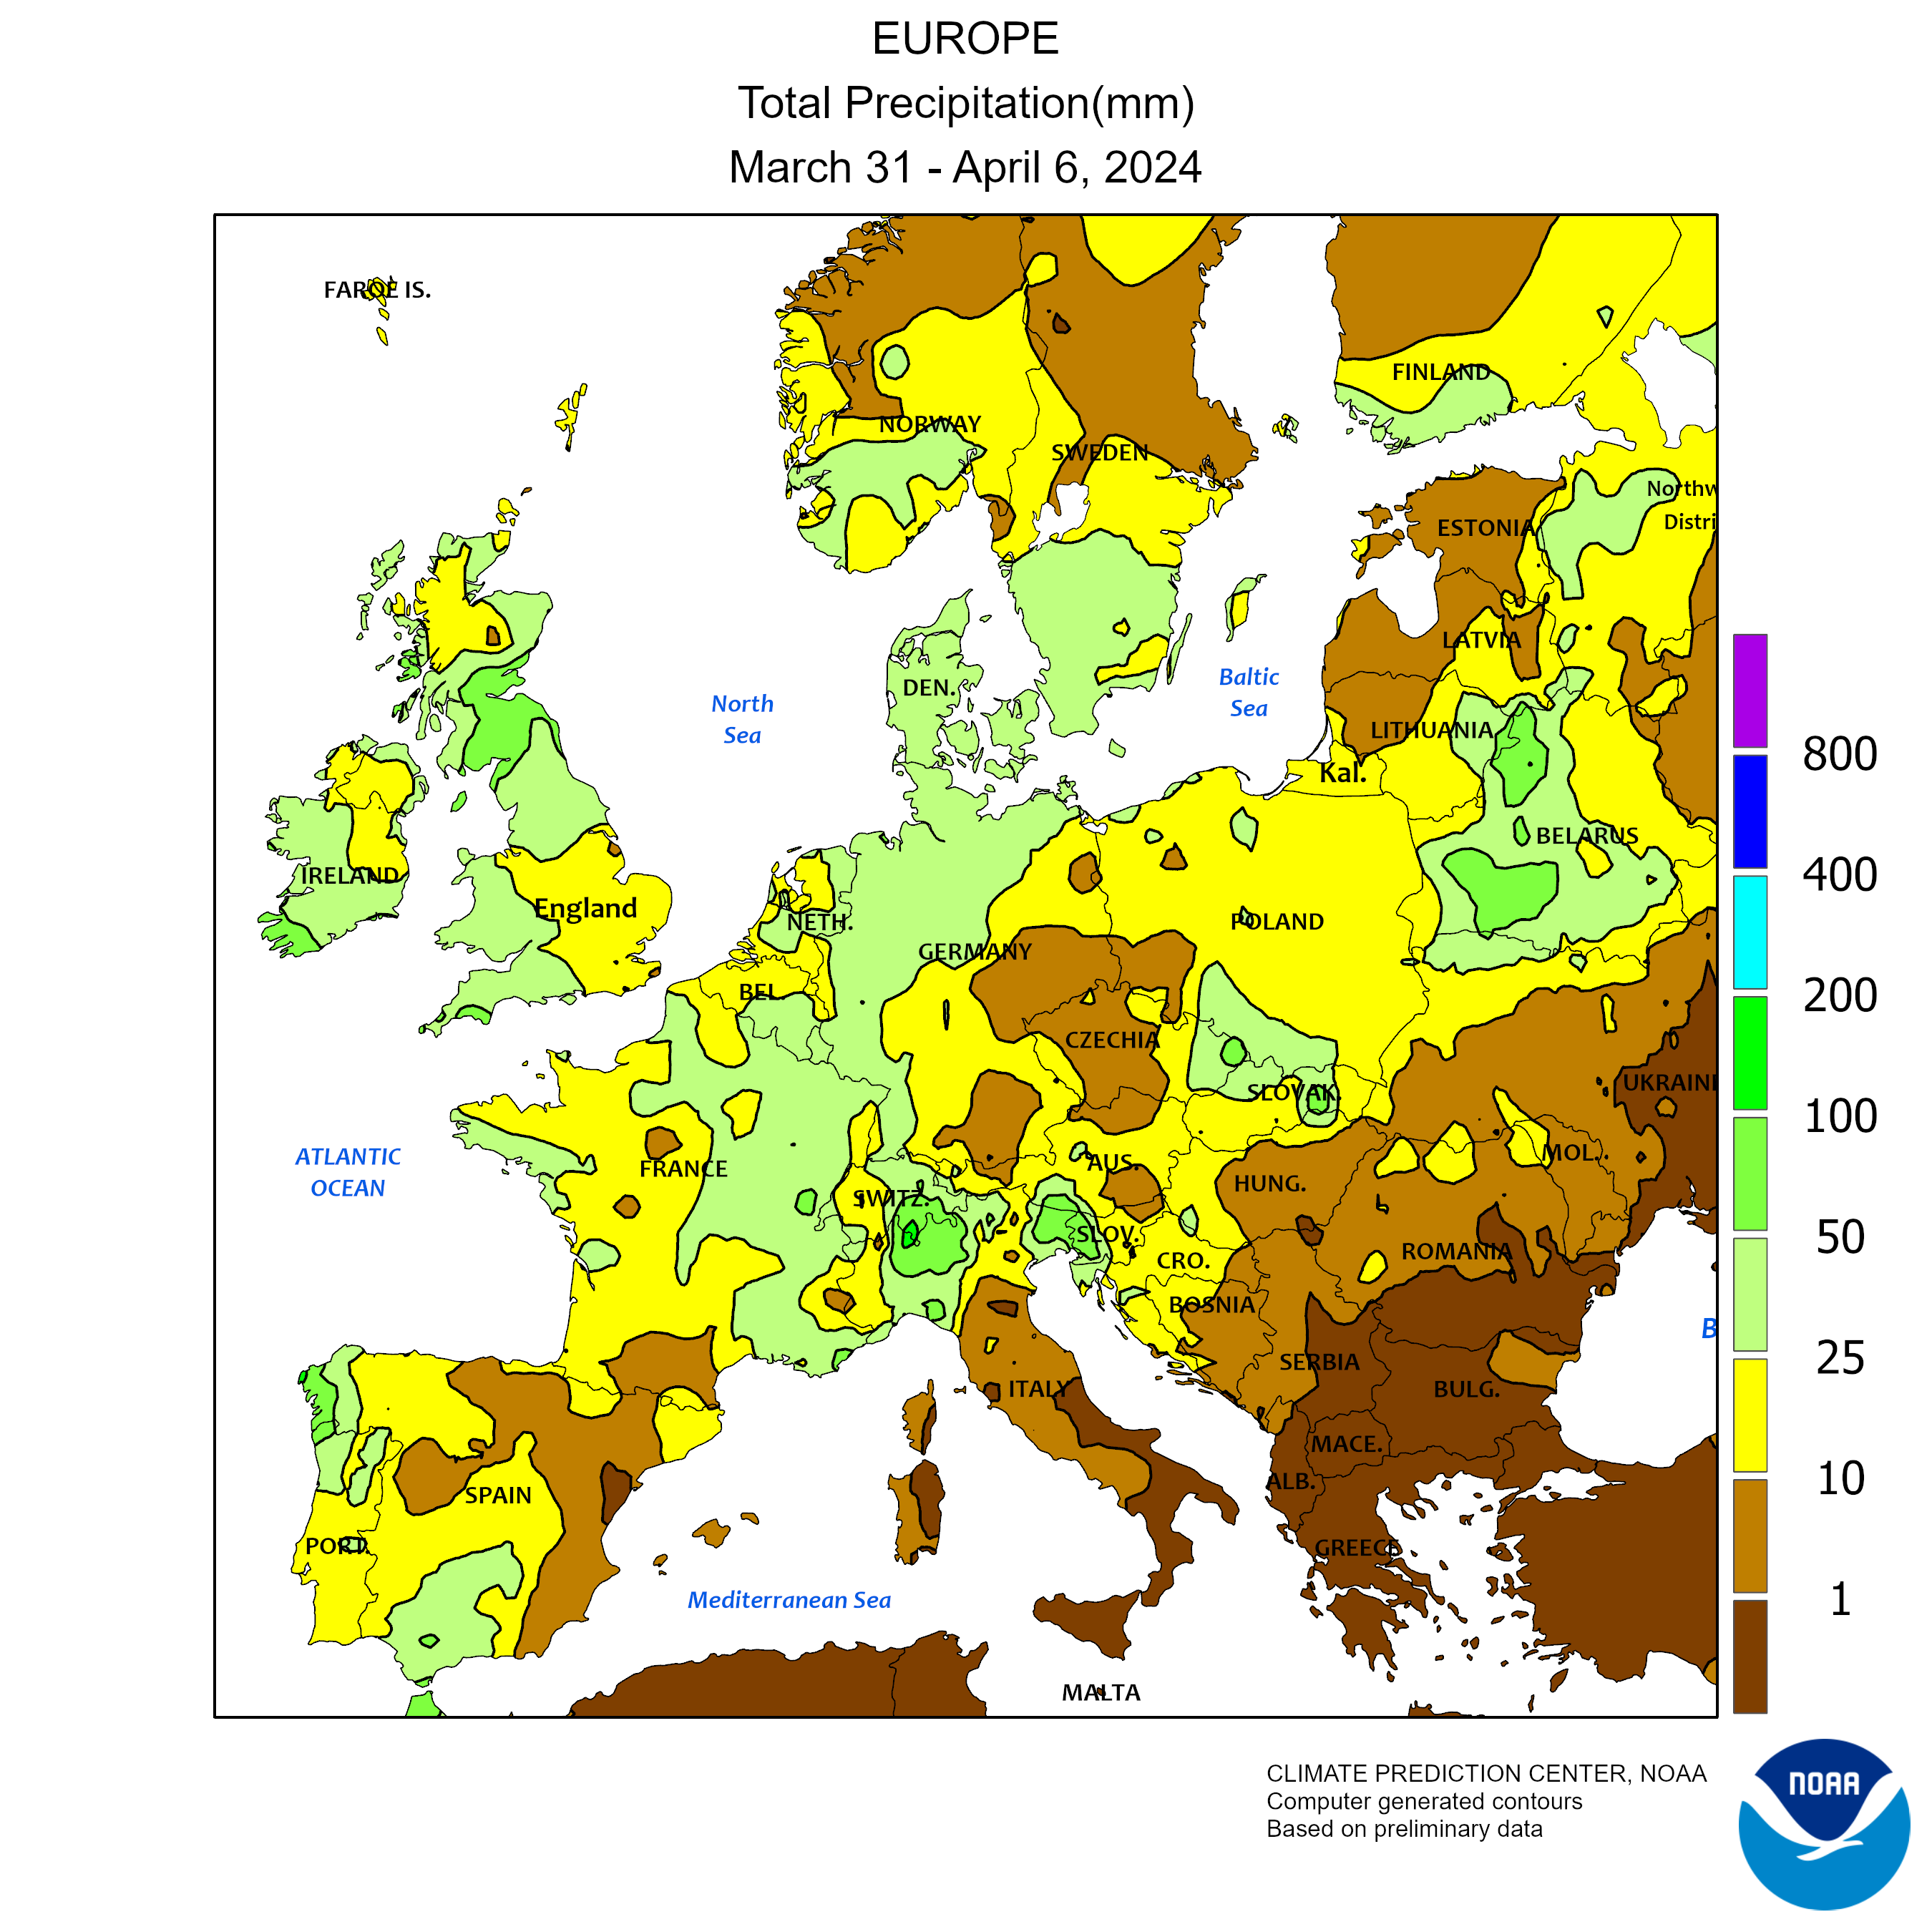
Total Precipitation
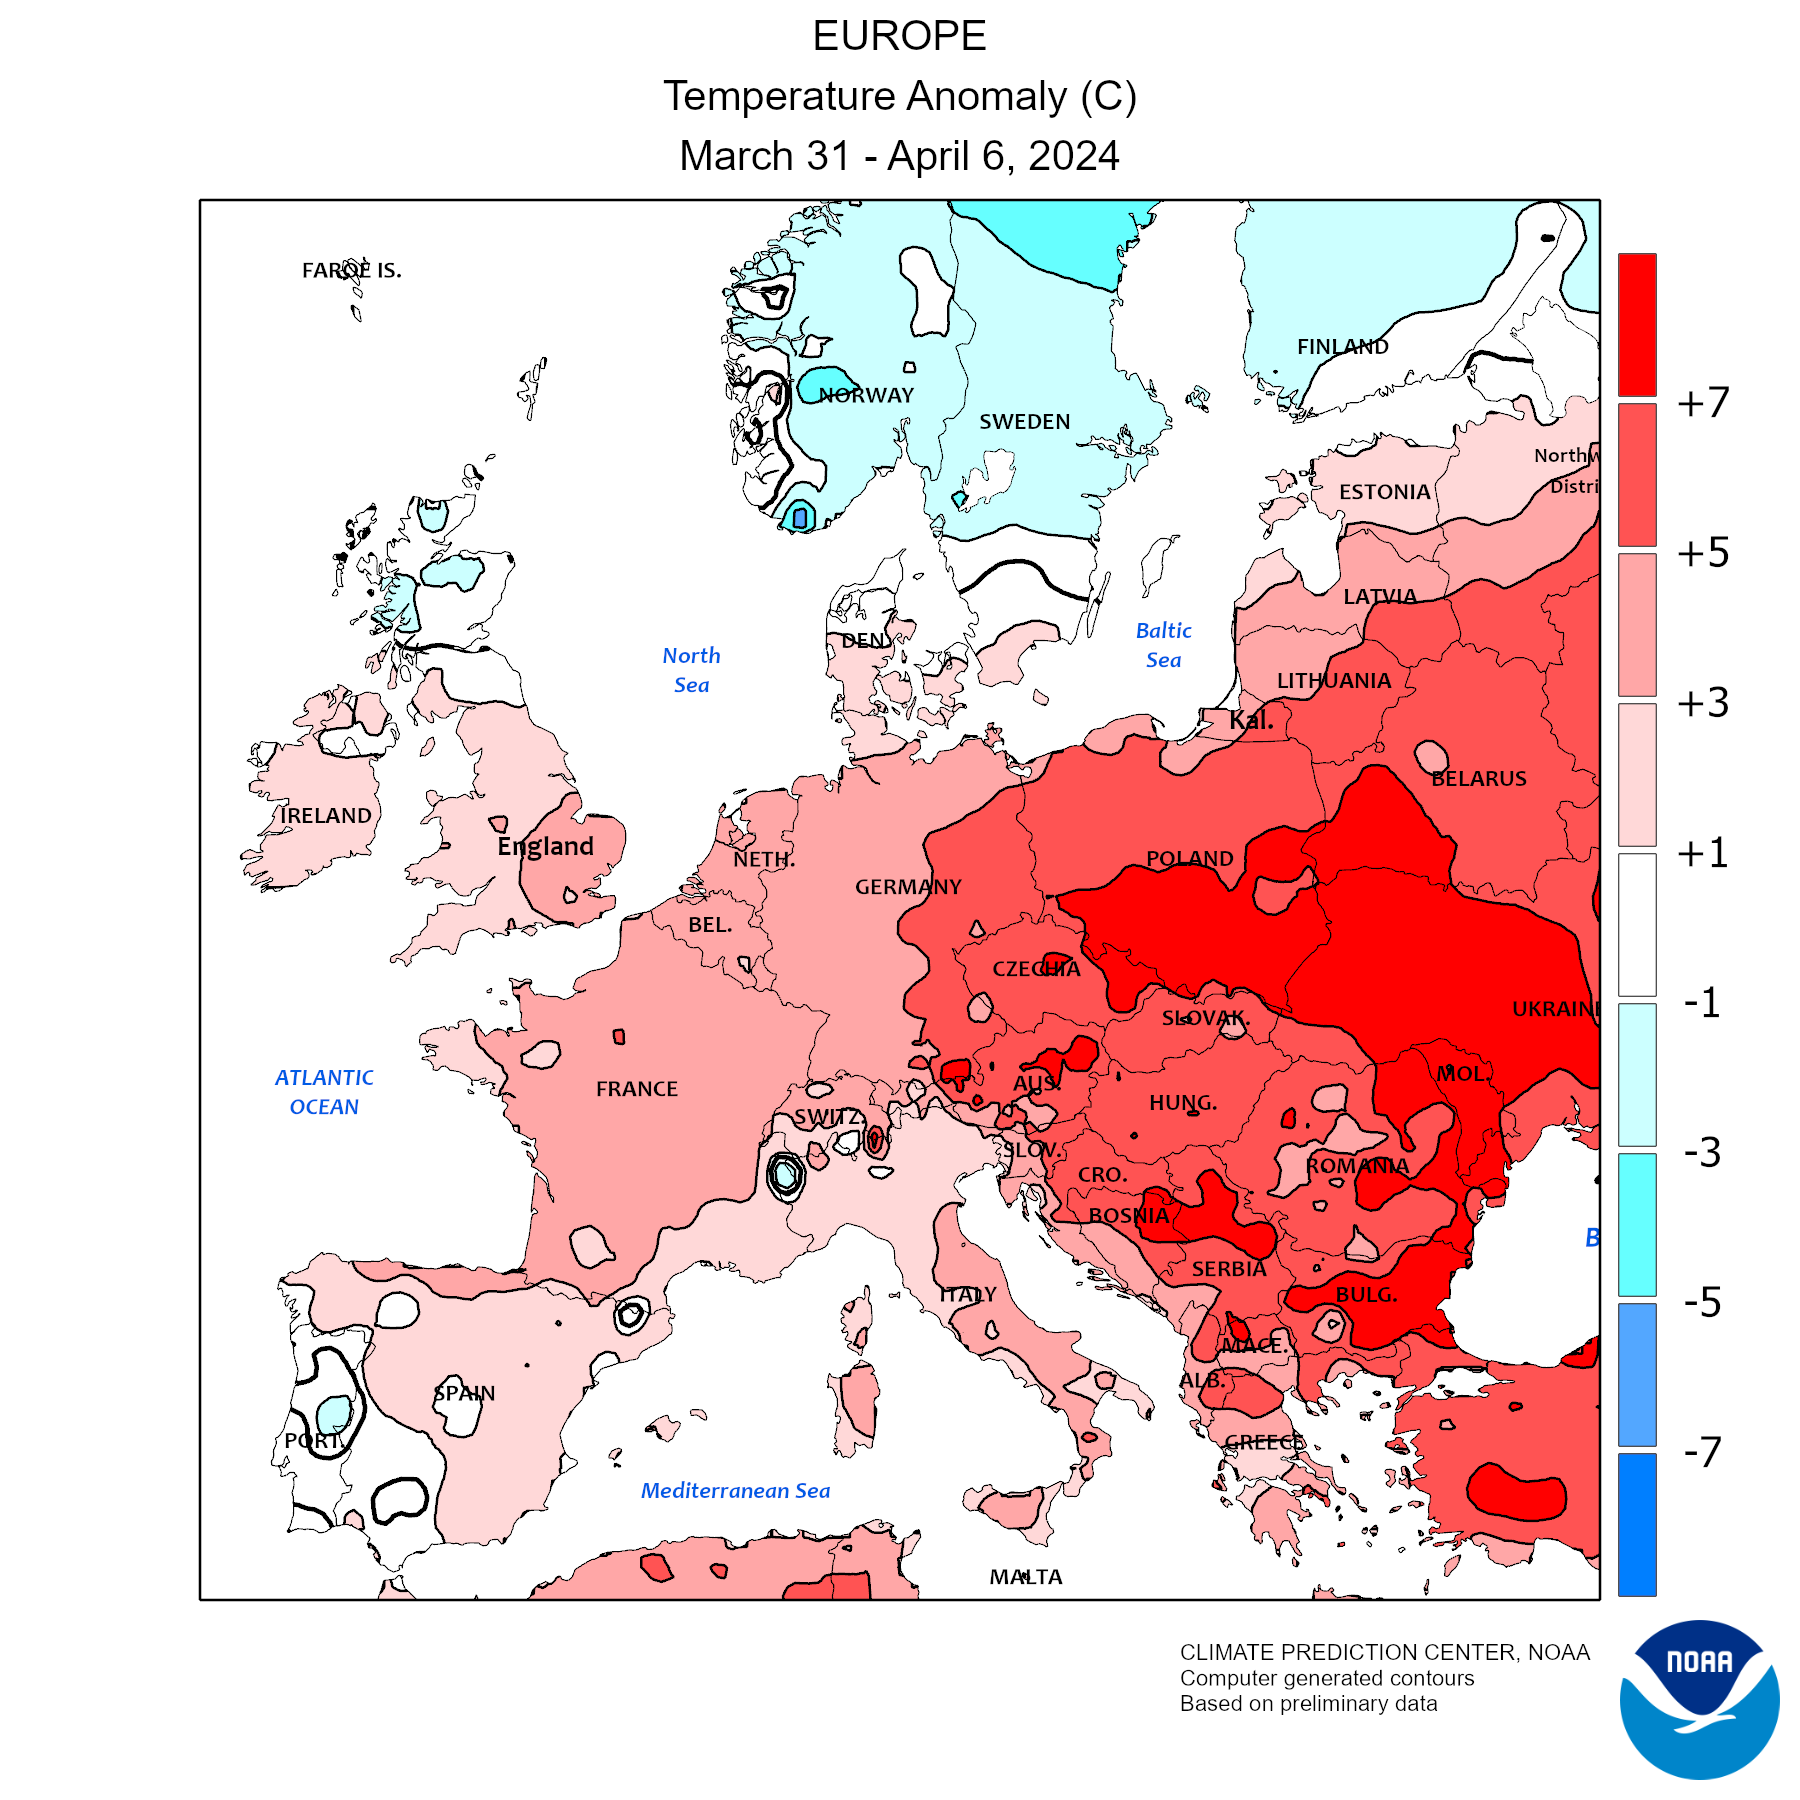
Temperature anomalies
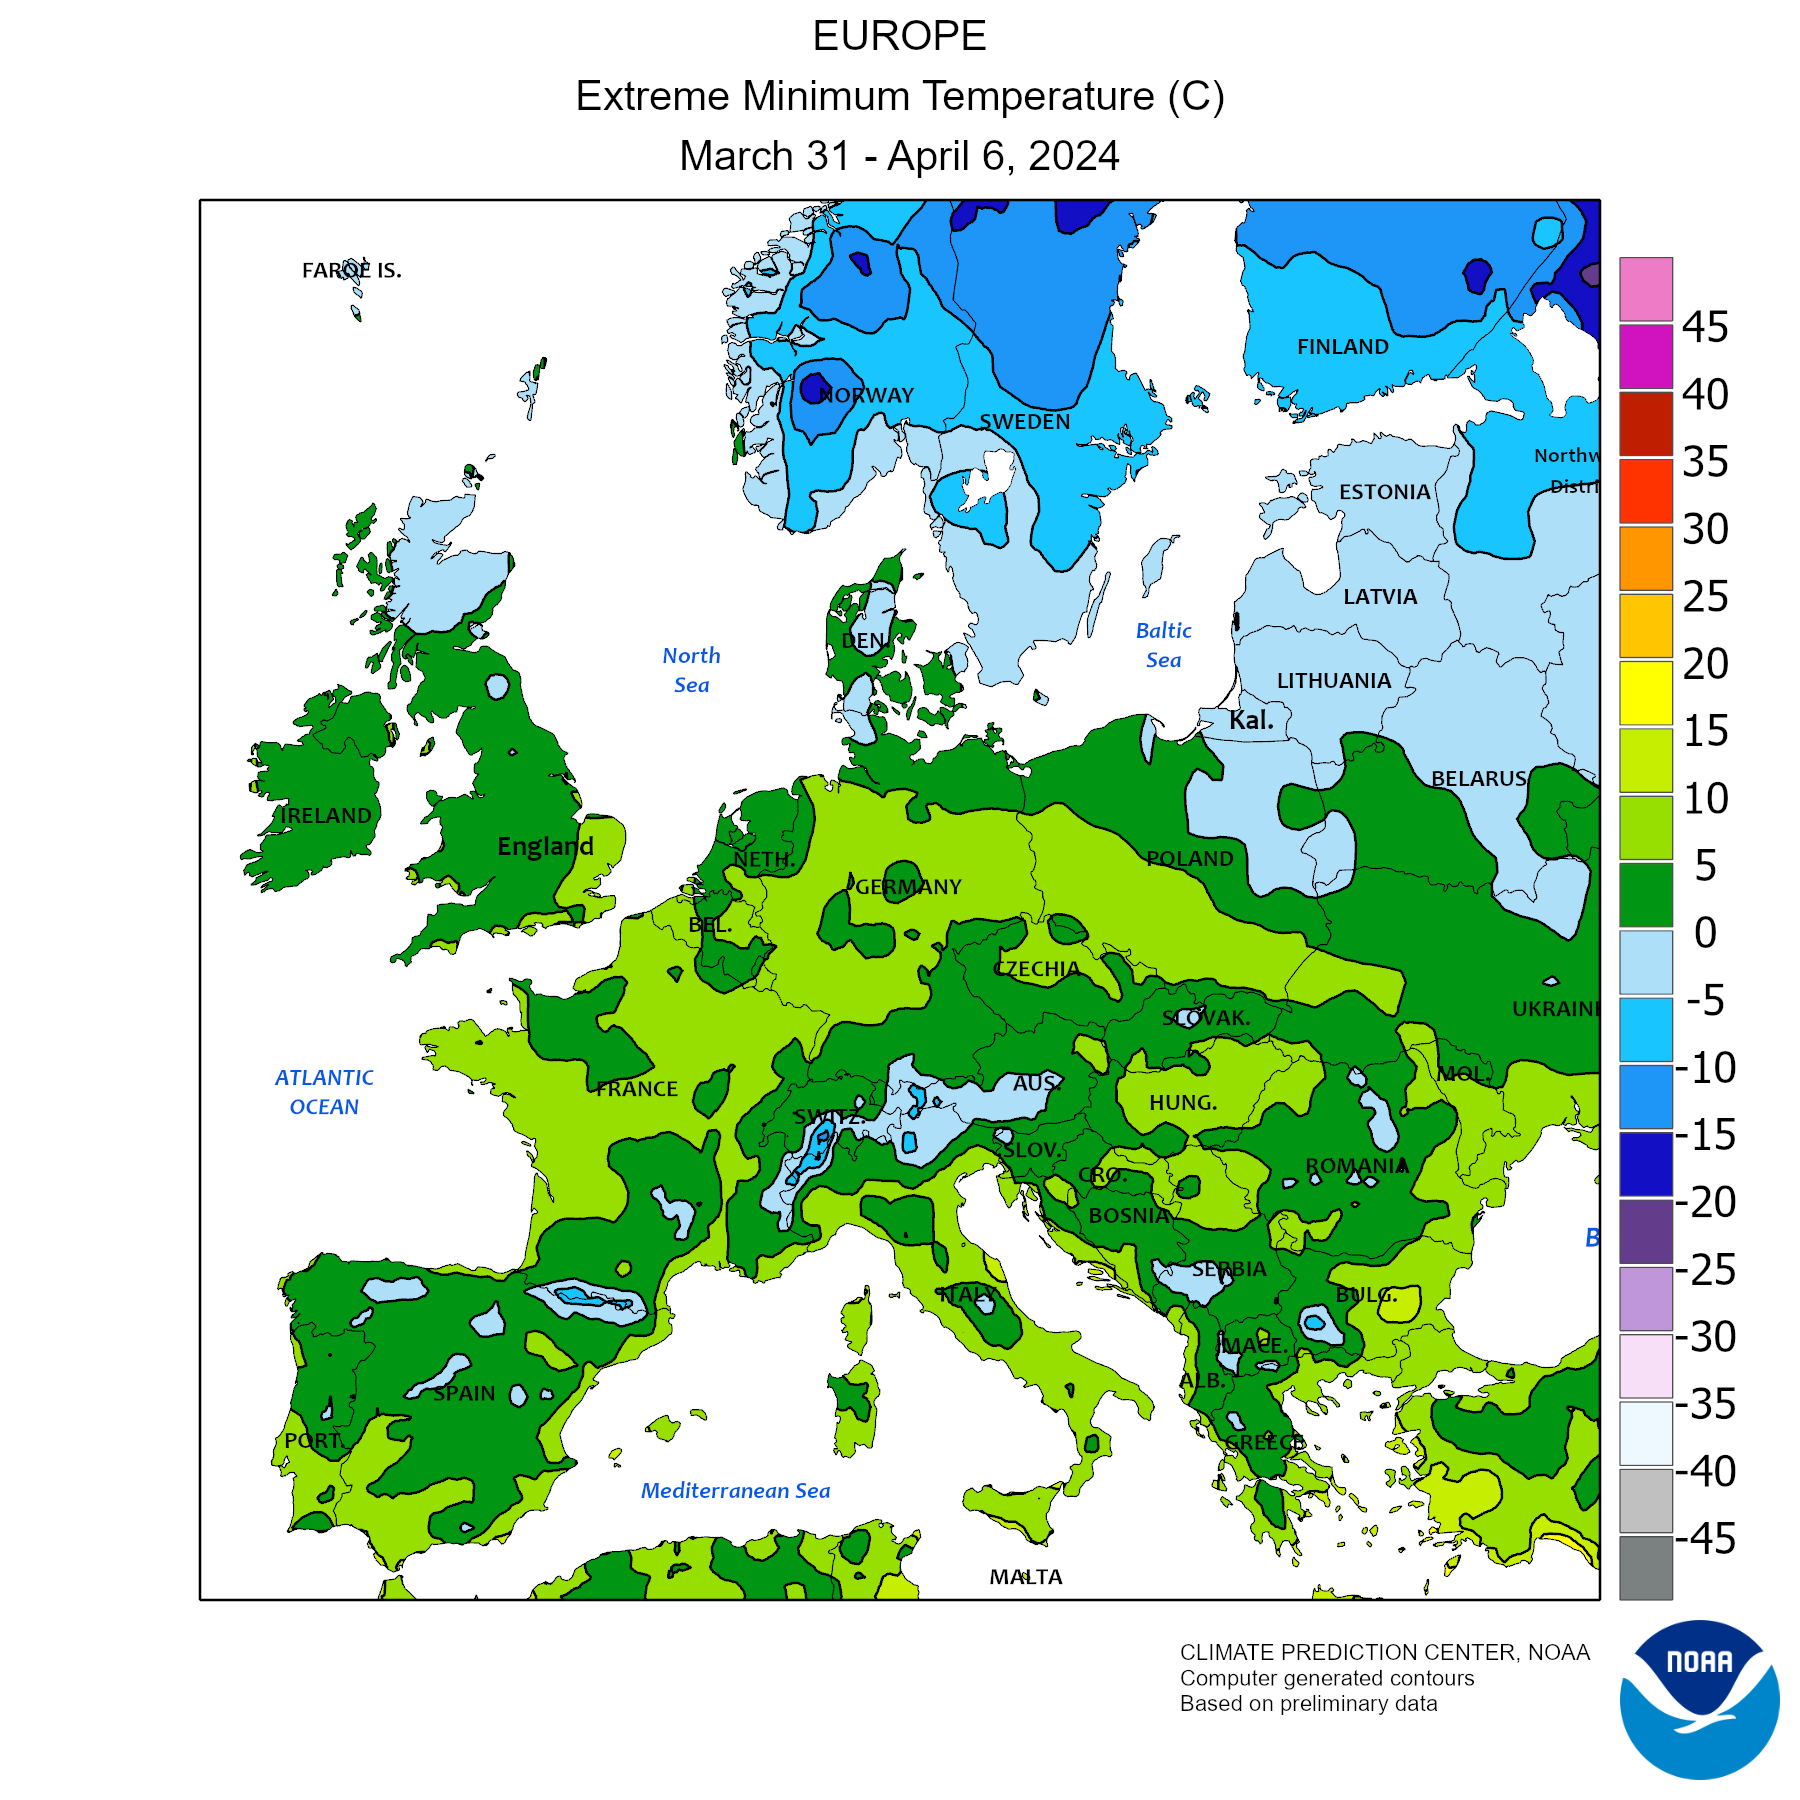
Min Temperature
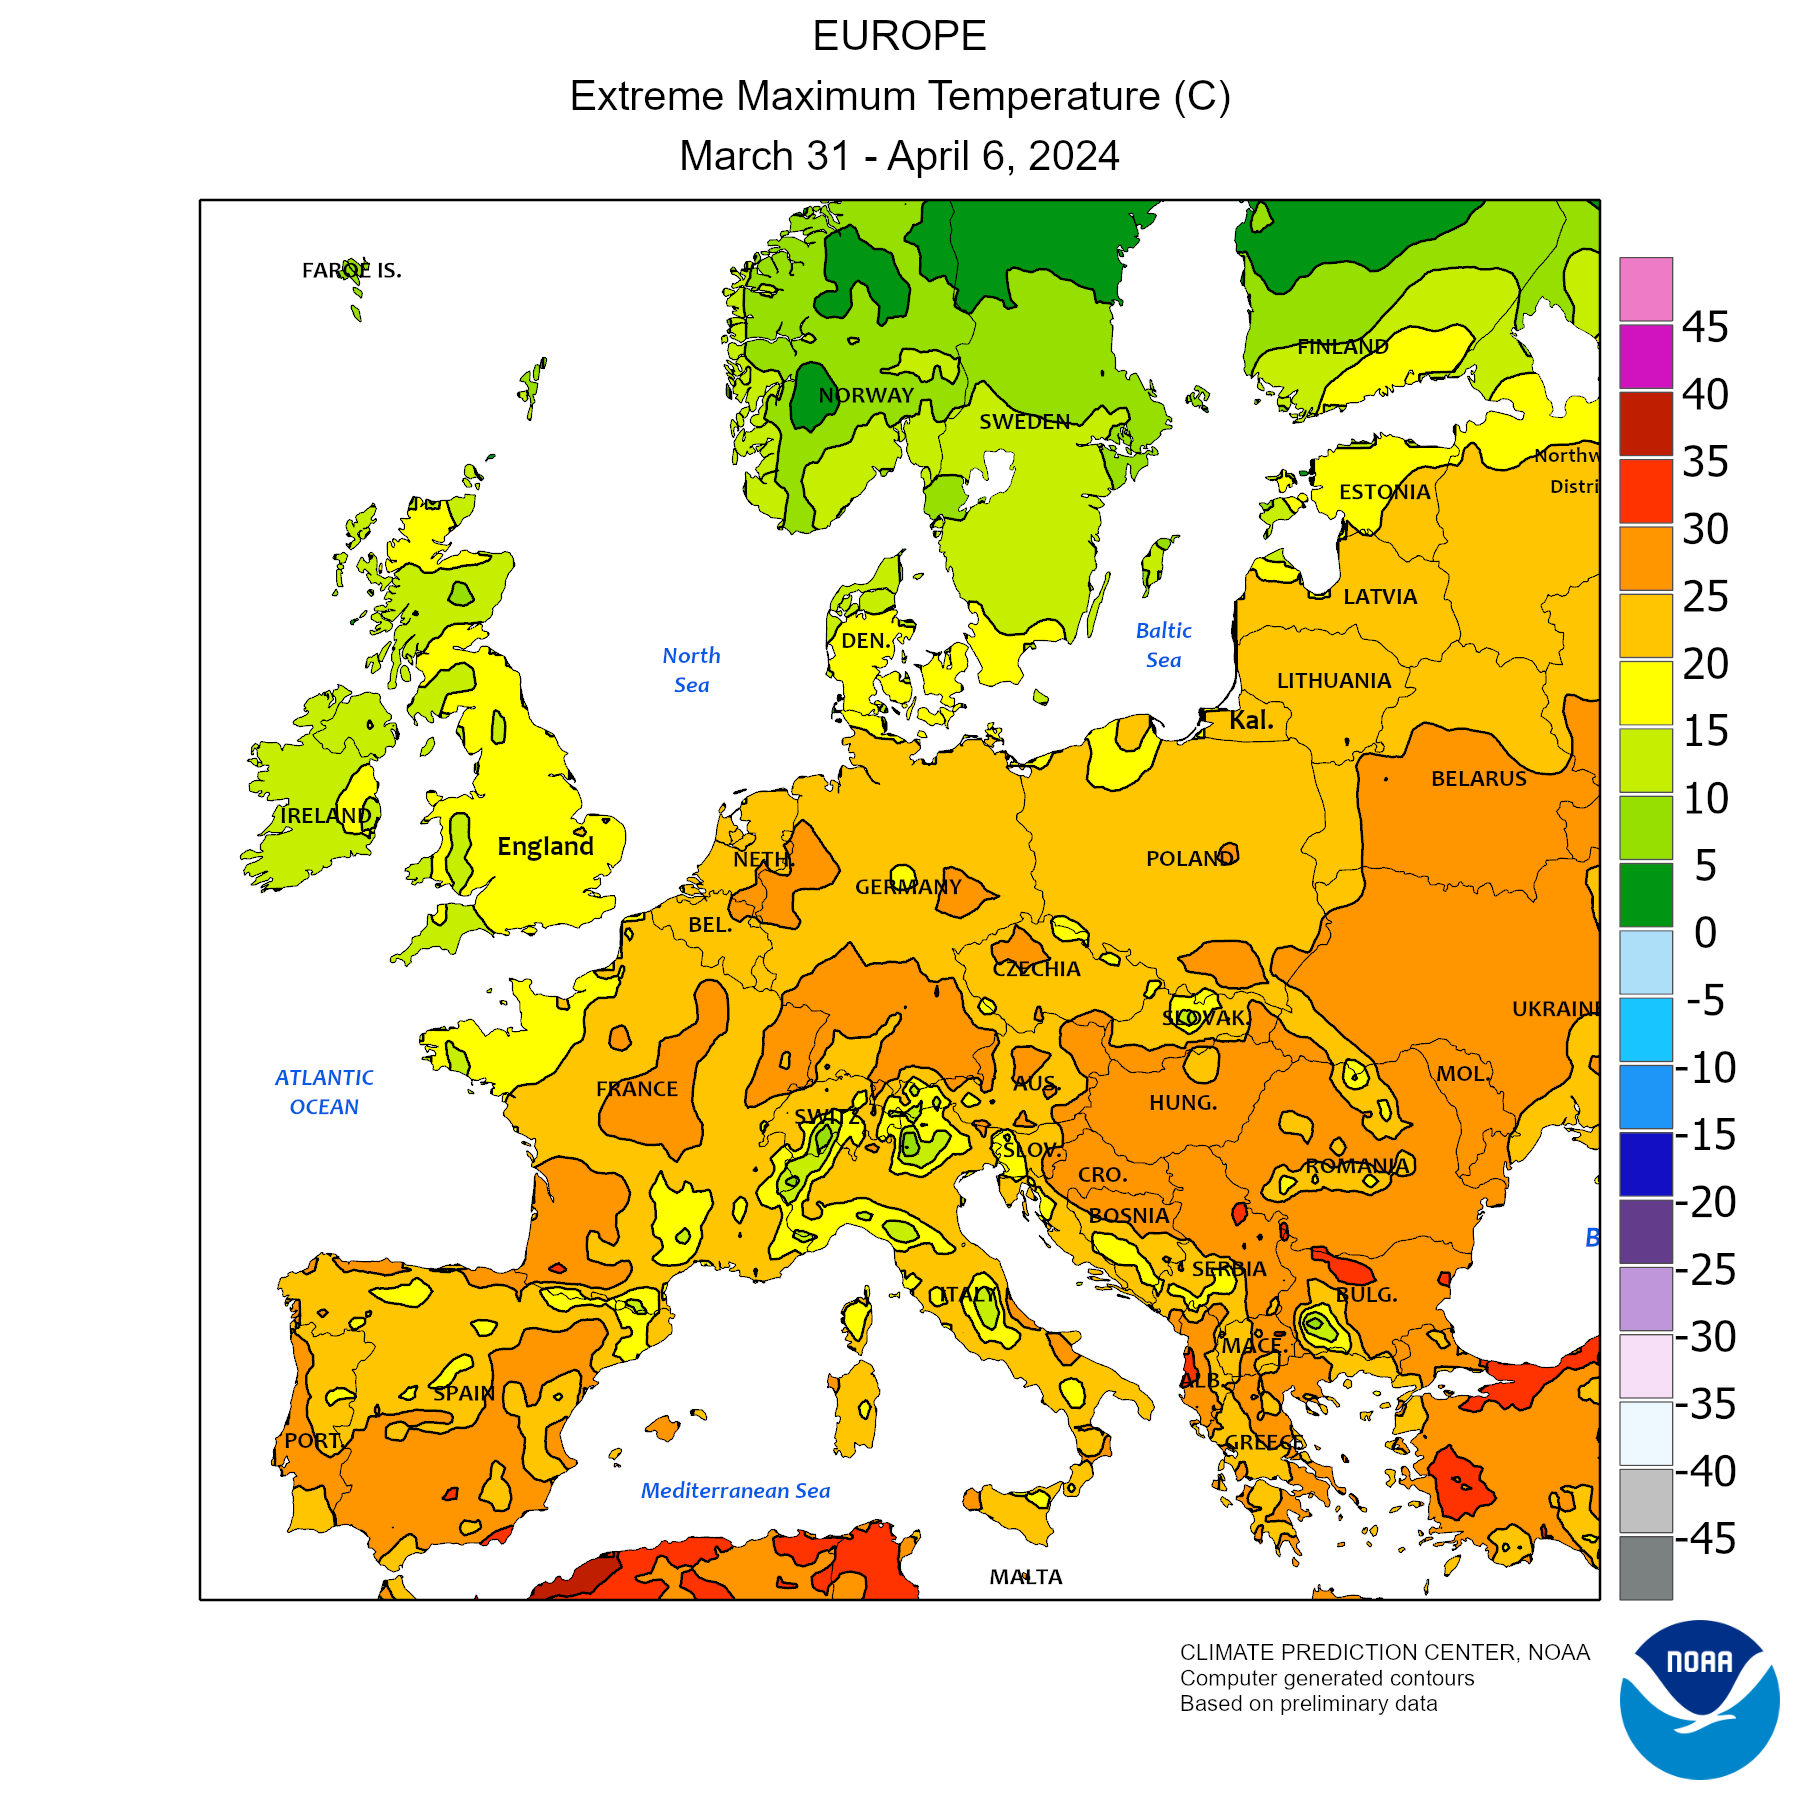
Max Temperature
×
×
×
×
| GERMANY: DAIRY SECTOR | |||||||||
| x 1.000 ton | |||||||||
| RAW MATERIAL AREA | 2020 | 2021 | 2022 | 2023 | 2023 | 2024 | % | Period | |
| Cow's Milk | |||||||||
| Dairy Farm Structure | |||||||||
| Live bovine animals ('000 Head) | 11.302 | 11.040 | 10.997 | 10.836 | |||||
| of which | |||||||||
| Dairy Cows ('000 head) | 3.921 | 3.833 | 3.810 | 3.713 | |||||
| Slaughtered cows ('000 head) | 1.106 | 1.119 | 1.008 | 1.006 | 87 | 90 | +2,8% | Jan 2024 | |
| Export of Breeding Heifers (HS 01022110 - head) | 75.460 | 61.543 | 31.880 | 36.112 | 3.175 | 2.580 | -18,7% | Jan 2024 | |
| Import of Breeding Heifers (HS 01022110 - head) | 1.864 | 1.530 | 219 | 1.944 | - | 99 | 0,0% | Jan 2024 | |
| Milk production | 33.165 | 32.507 | 32.399 | ||||||
| ± % Over the same period of the previous year | -2,0% | -0,3% | |||||||
| Raw cows' milk delivered to dairies (Cod. Eurostat D1110D) | 32.549 | 31.942 | 31.947 | 32.424 | 5.318 | 5.346 | +0,5% | Jan-Feb 2024 | |
| ± % Over the same period of the previous year | -1,9% | 0,0% | +1,5% | ||||||
| % Delivery on production *** | 98,1% | 98,3% | 98,6% | ||||||
| % Protein | 3,47% | 3,46% | 3,44% | 3,46% | 3,49% | 3,52% | Jan-Feb 2024 | ||
| % Fat | 4,13% | 4,15% | 4,08% | 4,12% | 4,20% | 4,20% | Jan-Feb 2024 | ||
| Farm-gate milk prices**** m.g. 4% p.p. prot. 3,4% p.p.(€ x 100 kg, VAT not include)1) | 32,84 | 36,27 | 53,18 | 45,34 | 54,70 | 44,07 | -19,4% | Jan-Feb 2024 | |
| ± % Over the same period of the previous year | +10,4% | +46,6% | -14,7% | ||||||
| Organic Milk Deliveries ('000 Ton) | 1.234 | 1.266 | 1.318 | 1.382 | 224 | 229 | +2,2% | Jan-Feb 2024 | |
| Organic cow milk prices*** (€ x 100 kg, VAT not include) | 47,78 | 49,81 | 57,61 | 57,39 | 62,25 | 55,92 | -10,2% | Jan-Feb 2024 | |
| Organic milk production (goat, sheep, cow) | 1.234 | 1.272 | 1.323 | - | |||||
| Buffalo's - Goat's - Sheep's Milk | |||||||||
| Buffaloes ('000) | 11 | 11 | 12 | 12 | |||||
| Goats ('000) | 161 | 164 | 159 | 163 | |||||
| Deliveries of Goat’s and Sheep’s Organic Milk ('000 Ton) | 16 | 15 | 15 | 13 | 2,0 | 1,7 | -17,0% | Jan-Feb 2024 | |
| Prices of Goat’s and Sheep’s Organic Milk (€ x 100 kg, VAT not include) | 69 | 70 | 72 | - | 80 | 81 | +1,9% | Jan-Feb 2024 | |
| Sheeps ('000) | 1.484 | 1.508 | 1.517 | 1.560 | |||||
| DAIRY PRODUCTION | 2020 | 2021 | 2022 | 2023 | 2023 | 2024 | % | Period | |
| Drinking milk (Cod. Eurostat D2100) | 4.566 | 4.380 | 4.103 | 4.032 | 660 | 665 | +0,9% | Jan-Feb 2024 | |
| Cream for direct consumption (Cod. Eurostat D2200V) | 530 | 544 | 525 | 521 | 74 | 81 | +9,1% | Jan-Feb 2024 | |
| Acidified milk (yoghurts and other) (Cod. Eurostat D4100) | 1.824 | 1.751 | 1.691 | 1.695 | 270 | 292 | +8,3% | Jan-Feb 2024 | |
| of which | |||||||||
| Yoghurt products | 673 | 643 | 637 | 655 | |||||
| Buttermilk products | 104 | 98 | 92 | 86 | |||||
| Butter (Cod. Eurostat D6000) | 506 | 471 | 473 | 480 | 87 | 87 | -0,2% | Jan-Feb 2024 | |
| Rendered butter and butteroil (Cod.Eurostat D6200) | 52 | 58 | 61 | - | |||||
| Mixed fats | 89 | 84 | 78 | 78 | |||||
| Other Yellow Fat Dairy Products (Cod. Eurostat D6900) | 8,0 | 7,7 | 7,7 | - | |||||
| Cheese from cows' milk (Cod. Eurostat D7121) | 2.449 | 2.461 | 2.430 | 2.451 | 394 | 406 | +3,1% | Jan-Feb 2024 | |
| Hard cheese (Hartkäse) | 193 | 189 | 187 | 180 | |||||
| Sour milk cheese (Sauermilchquarkerzeugnisse) | 23 | 22 | 20 | 19 | |||||
| Cut cheese (Schnittkäse) | 745 | 759 | 751 | 778 | |||||
| Semi-hard cheese (Halbfester Schnittkäse) | 56 | 57 | 57 | 56 | |||||
| Soft cheese (Weichkäse) | 167 | 168 | 165 | 159 | |||||
| Pasta Filata cheese (Pasta Filata Käse) | 425 | 447 | 456 | 462 | |||||
| Cream cheese (Frischkäse) | 835 | 816 | 790 | 792 | |||||
| Cooked and whey cheese (Koch- und Molkenkäse) | 3,9 | 4,2 | 3,9 | 3,7 | |||||
| Total Cheese (Cod. Eurostat D7100) | 2.355 | 2.361 | 2.334 | - | |||||
| I° Classificazione | |||||||||
| - Soft cheese ( Cod. Eurostat D7111) | 160 | 160 | 158 | - | |||||
| - Medium soft cheese ( Cod. Eurostat D7112) | 55 | 55 | 55 | - | |||||
| - Medium hard cheese ( Cod. Eurostat D7113) | 724 | 733 | 725 | - | |||||
| - Hard cheese ( Cod. Eurostat D7114) | 154 | 149 | 148 | - | |||||
| - Fresh cheese ( Cod. Eurostat D7116) | 1.262 | 1.265 | 1.248 | - | |||||
| 2° Classificazione | |||||||||
| - Cheese from cows'milk (pure) ( Cod. Eurostat D7121) | 2.354 | 2.359 | 2.333 | - | |||||
| Concentrated milk (Cod. Eurostat D3200) | 323 | 305 | 292 | 293 | 49 | 62 | +26,8% | Jan-Feb 2024 | |
| WMP - Milk and cream powders (excl. SMP) (Cod. Eurostat D3100_X_3113) | 283 | 292 | 309 | 305 | 48 | 38 | -21,1% | Jan-Feb 2024 | |
| SMP - Skimmed milk powder (SMP) (Cod. Eurostat D3113) | 417 | 353 | 352 | 347 | 67 | 64 | -3,3% | Jan-Feb 2024 | |
| Buttermilk powder | 25 | 22 | 24 | 22 | |||||
| Other powdered milk products | 161 | 175 | 179 | 177 | |||||
| Processed Cheese | 193 | 204 | 209 | 206 | |||||
| Drinks with a milk base (Cod. Eurostat D9100) | 585 | 643 | 703 | - | |||||
| Whey(Cod. Eurostat D5000) | 16.380 | 16.453 | 13.907 | - | |||||
| of which | |||||||||
| Whey liquid (Cod. Eurostat D5100) | 2.179 | 2.188 | 1.850 | - | |||||
| Whey concentrated (Cod. Eurostat D5200) | 786 | 790 | 668 | - | |||||
| Whey (in powder or in block) | 317 | 370 | 371 | 384 | |||||
| Other fresh products (milk-based desserts, ice cream) (Cod. Eurostat D9200) | 673 | 696 | 764 | - | |||||
| EXPORT | 2020 | 2021 | 2022 | 2023 | Jan | of which Extra EU | 2023 2024 % | 2023 2024 % | |
| Cheese (0406) | TOP importers | 1.318 | 1.365 | 1.324 | 1.412 | 102 125 +22,6% | 20 24 +17,7% | ||
| Latte Sfuso (04011090+04012019+04012099) | TOP importers | 1.236 | 1.101 | 929 | 1.231 | 97 128 +32,1% | 1,3 0,5 -62,0% | ||
| Whole (04012099) | TOP importers | 970 | 943 | 810 | 1.058 | 83 112 +35,6% | 0,5 0,5 -0,3% | ||
| Semi-skimmed (04012019) | TOP importers | 64 | 50 | 27 | 38 | 4,3 2,6 -38,7% | - - - | ||
| Skimmed (04011090) | TOP importers | 202 | 108 | 92 | 135 | 9,8 13 +33,7% | - - - | ||
| Yogurt and buttermilk (0403) | TOP importers | 669 | 641 | 600 | 594 | 42 53 +27,2% | 11 13 +16,1% | ||
| Latte Confezionato (04011010+04012011+04012091) | TOP importers | 694 | 733 | 496 | 522 | 34 45 +32,2% | 21 24 +17,9% | ||
| Whole (04012091) | TOP importers | 388 | 454 | 276 | 306 | 19 26 +38,4% | 15 17 +14,3% | ||
| Semi-Skimmed (04012011) | TOP importers | 160 | 149 | 143 | 150 | 11 14 +32,2% | 2,4 3,8 +57,6% | ||
| Skimmed (04011010) | TOP importers | 146 | 130 | 78 | 66 | 4,4 4,7 +6,1% | 3,5 3,6 +5,3% | ||
| Whey (0404) | TOP importers | 542 | 568 | 501 | 469 | 35 42 +20,3% | 11 12 +4,9% | ||
| Sweet dairy Whey (12% protein) and WPC (040410) | TOP importers | 478 | 503 | 444 | 420 | 31 37 +19,9% | 11 11 +4,6% | ||
| Fat-Filled Milk Powder (FFMP) (190190) | TOP importers | 393 | 401 | 392 | 402 | 30 38 +26,3% | 8,3 13 +52,3% | ||
| Condensed Milk (040291+040299) | TOP importers | 303 | 295 | 315 | 370 | 31 31 -1,2% | 6,4 3,5 -44,6% | ||
| SMP (040210) | TOP importers | 370 | 327 | 293 | 297 | 28 26 -4,7% | 11 10 -6,9% | ||
| Lactose Pharmaceutical (170211) | TOP importers | 236 | 243 | 249 | 261 | 19 25 +29,7% | 10,0 11 +7,3% | ||
| Cream (040130+040140+040150) | TOP importers | 221 | 239 | 228 | 242 | 20 17 -15,7% | 2,2 2,9 +33,0% | ||
| Butter And Other Fats (0405) | TOP importers | 156 | 156 | 146 | 153 | 14 15 +6,9% | 1,9 1,5 -18,7% | ||
| Anhydrous Milk Fat (040590) | TOP importers | 21 | 24 | 24 | 21 | 2,4 1,6 -33,1% | 0,1 0,1 -40,8% | ||
| Other Product | 201 | 201 | 223 | 246 | 18 21 +16,6% | 8,3 11 +26,3% | |||
| Soya-based beverages (protein content >=2,8 %) | 10,0 | 9,5 | 9,8 | 8,6 | 0,6 1,1 +87,2% | - - - | |||
| Soya-based beverages (protein content of <2.8%) based on nuts, cereals or seeds | 108 | 108 | 78 | 87 | 5,9 9,0 +52,3% | - - - | |||
| Non-alcoholic beverages containing < 0,2% fats derived from milk or milk products | 77 | 79 | 82 | 90 | 6,7 9,4 +39,4% | - - - | |||
| IMPORT | 2020 | 2021 | 2022 | 2023 | Jan | of which Extra EU | 2023 2024 % | 2023 2024 % | |
| Latte Sfuso (04011090+04012019+04012099) | TOP exporters | 2.356 | 2.411 | 2.522 | 2.748 | 143 248 +73,0% | 0,2 0,2 -12,2% | ||
| Whole (04012099)Revision Data | TOP exporters | 2.218 | 2.263 | 2.357 | 2.624 | 132 237 +79,3% | 0,2 0,2 -12,4% | ||
| Semi-skimmed (04012019) | TOP exporters | 15 | 25 | 22 | 19 | 2,2 2,4 +9,0% | - - - | ||
| Skimmed (04011090) | TOP exporters | 123 | 123 | 144 | 105 | 8,9 8,5 -4,1% | - - - | ||
| Cheese (0406) | TOP exporters | 894 | 914 | 891 | 875 | 64 74 +17,0% | 2,9 3,6 +26,5% | ||
| Whey (0404) | TOP exporters | 602 | 655 | 631 | 577 | 34 58 +71,2% | 0,2 0,6 +306,6% | ||
| Sweet dairy Whey (12% protein) and WPC (040410) | TOP exporters | 535 | 562 | 518 | 470 | 25 49 +93,5% | 0,1 0,5 +531,6% | ||
| Latte Confezionato (04011010+04012011+04012091) | TOP exporters | 215 | 196 | 200 | 250 | 18 21 +18,3% | 0,0 0,3 +757,2% | ||
| Whole (04012091) | TOP exporters | 62 | 67 | 84 | 116 | 7,4 11 +46,4% | 0,0 0,2 0,0% | ||
| Semi-Skimmed (04012011) | TOP exporters | 153 | 128 | 115 | 134 | 11 10 -1,5% | - - - | ||
| Skimmed (04011010) | TOP exporters | 0,6 | 0,8 | 0,6 | 0,7 | 0,1 0,1 +26,1% | 0,0 0,1 >1000% | ||
| Yogurt and buttermilk (0403) | TOP exporters | 175 | 199 | 204 | 218 | 15 22 +53,4% | 0,2 0,6 +223,6% | ||
| Cream (040130+040140+040150) | TOP exporters | 195 | 202 | 194 | 158 | 9,9 17 +66,7% | 0,1 0,1 +93,7% | ||
| Butter And Other Fats (0405) | TOP exporters | 192 | 204 | 170 | 152 | 8,3 11 +26,8% | 0,1 0,2 +124,0% | ||
| Anhydrous Milk Fat (040590) | TOP exporters | 21 | 20 | 19 | 19 | 1,3 1,5 +15,9% | - - - | ||
| Fat-Filled Milk Powder (FFMP) (190190) | TOP exporters | 98 | 107 | 107 | 116 | 7,9 8,6 +8,4% | 0,7 0,8 +14,0% | ||
| Condensed Milk (040291+040299) | TOP exporters | 114 | 111 | 116 | 100 | 6,1 10 +70,3% | 0,0 0,3 >1000% | ||
| Other Product | 246 | 227 | 240 | 238 | 21 24 +10,9% | 0,7 0,7 -6,7% | |||
| Soya-based beverages (protein content >=2,8 %) | 54 | 90 | 77 | 66 | 7,8 4,7 -40,3% | - - - | |||
| Soya-based beverages (protein content of <2.8%) based on nuts, cereals or seeds | 154 | 206 | 138 | 209 | 11 22 +93,3% | - - - | |||
| Non-alcoholic beverages containing < 0,2% fats derived from milk or milk products | 18 | 13 | 15 | 13 | 1,1 1,2 +10,3% | - - - | |||
| PER CAPITA CONSUMPTIONS (kg) | 2020 | 2021 | 2022 | 2023 | 2023 | 2024 | % | Period | |
| Cheese | 25,3 | 25,3 | n.d. | n.d. | |||||
| di cui | |||||||||
| Fresh cheeses | 7,1 | 6,9 | n.d. | n.d. | |||||
| Butter | 6,3 | 6,1 | n.d. | n.d. | |||||
| Cream | 5,7 | 5,3 | n.d. | n.d. | |||||
| Condensed Milk | 1,6 | 1,4 | n.d. | n.d. | |||||
| SMP and Buttermilk powder | 1,5 | 1,0 | n.d. | n.d. | |||||
| % Self-sufficiency rate | 128,5% | 128,0% | 122,8% | 127,4% | 131,3% | Jan 2024 | |||
| SOCIO-ECONOMIC INDICATORS | 2020 | 2021 | 2022 | 2023 | 2023 | 2024(f) | % | Period | |
| GDP (gross domestic product) | -6,24% | 5,89% | 3,43% | 0,51% | 0,51% | 0,40% | Jan-Dic 2024 | ||
| CPI (consumer price index) | 0,37% | 3,21% | 8,67% | 6,03% | 6,03% | 2,80% | Jan-Dic 2024 | ||
| Population ('000) | 83.167 | 83.155 | 83.237 | 84.359 | |||||
| GDP per capita (U.S. dollars) | 46.712 | 51.461 | 48.756 (e) | 52.824 (e) | |||||
| GDP per capita (€) * | 40.870 | 43.510 | 46.300(e) | 48.852(e) | |||||
Informative Note
(f): forecast
(e) estimated
* Per capita GDP in Euro is calculated by using the yearly average exchange rate
**** Weighted average annual price, except for 2024 when the average price is arithmetic. Since January 2010 Fat content, to which farm-gate milk price refers, has increased from 3,70 % to 4,00 %.
1) The price is ex farm.
*** Milk price "ab Hof", 4% fat content and 3,4% protein content.
SOURCES
Raw material area: Sheep and Goat Milk Deliveries: Eurostat (annual data dataset: apro_mk_pobta); Milk Deliveries, % Protein e % Fat: Eurostat (dataset: apro_mk_colm); Milk Production: Eurostat (dataset: agr_r_milkpr); Number of cows: Eurostat (dataset: agr_r_animal); Number of Goats, Sheeps and Bufaloes: Eurostat (dataset: apro_mt_lsgoat, apro_mt_lssheep, apro_mt_lscatl ); Sheep and Goat Milk Production: Eurostat (annual data dataset: apro_mk_farm); Farm-gate milk conventional and organic prices: ZMB, BLE, estimates made by AMI ; Import/Export of Breeding Heifers: IHS ; Organic Milk Production: Eurostat (dataset: org_aprod);
Dairy production: (annual data dataset: apro_mk_pobta, monthly data dataset: apro_mk_colm) , Eurostat+BLE
Export: Eurostat
Import: Eurostat
Per capita consumption: BLE
GDP and CPI: Intesa Sanpaolo
GDP per capita: International Monetary Found
Population: Eurostat
*** MILK DELIVERIES AND MILK PRODUCTION
Note: Self-sufficiency rate = Milk deliveries/(Domestic use in milk equivalent ME)
Domestic use in milk equivalent (ME) = Milk deliveries + Import in ME - Export in ME
The Self-sufficiency rate does not consider the trade of FFMP (fat-filled milk powder) - HS 190190 and the infant milk formula.
Last update: 24-04-2024
(e) estimated
* Per capita GDP in Euro is calculated by using the yearly average exchange rate
**** Weighted average annual price, except for 2024 when the average price is arithmetic. Since January 2010 Fat content, to which farm-gate milk price refers, has increased from 3,70 % to 4,00 %.
1) The price is ex farm.
*** Milk price "ab Hof", 4% fat content and 3,4% protein content.
SOURCES
Raw material area: Sheep and Goat Milk Deliveries: Eurostat (annual data dataset: apro_mk_pobta); Milk Deliveries, % Protein e % Fat: Eurostat (dataset: apro_mk_colm); Milk Production: Eurostat (dataset: agr_r_milkpr); Number of cows: Eurostat (dataset: agr_r_animal); Number of Goats, Sheeps and Bufaloes: Eurostat (dataset: apro_mt_lsgoat, apro_mt_lssheep, apro_mt_lscatl ); Sheep and Goat Milk Production: Eurostat (annual data dataset: apro_mk_farm); Farm-gate milk conventional and organic prices: ZMB, BLE, estimates made by AMI ; Import/Export of Breeding Heifers: IHS ; Organic Milk Production: Eurostat (dataset: org_aprod);
Dairy production: (annual data dataset: apro_mk_pobta, monthly data dataset: apro_mk_colm) , Eurostat+BLE
Export: Eurostat
Import: Eurostat
Per capita consumption: BLE
GDP and CPI: Intesa Sanpaolo
GDP per capita: International Monetary Found
Population: Eurostat
*** MILK DELIVERIES AND MILK PRODUCTION
- Milk deliveries (apro_mk_colm): milk collected by dairies (located in the Member State) from the agricultural holdings (within or outside the Member State).
- Milk production (agr_r_milkpr): milk produced by agricultural holdings (located in the Member State) and a part of this milk is delivered to dairies (within or outside the Member State).
Note: Self-sufficiency rate = Milk deliveries/(Domestic use in milk equivalent ME)
Domestic use in milk equivalent (ME) = Milk deliveries + Import in ME - Export in ME
The Self-sufficiency rate does not consider the trade of FFMP (fat-filled milk powder) - HS 190190 and the infant milk formula.
Last update: 24-04-2024
NOTA: Access to Dairy World Trade,
which also contains the processing of Import / Export of the Germany with MONTHLY UPDATES,
is reserved for Supporters of CLAL.it